
Push-Up Test
Upper-Body Muscular Endurance (standard push-ups)
Keep your body straight from head to heels, lower until your chest is about a fist’s height from the floor, and press back to straight arms. Reps must be continuous: the test ends at your first pause or rest. Stop right away if you feel shoulder, elbow or wrist pain.
Based on Strength Level’s self-logged community data, mapped to Amatal’s tiers. People who log push-ups there are mostly regular gym-goers, so these standards are demanding, well above older clinical charts.
Retest every 4–6 weeks with the same protocol and compare against your own previous rep count. That comparison is the most reliable result on this page.
Based on Strength Level’s typical (50th percentile) result at each age from 40 to 65. Ages 25–40 share one peak value in that data.
Estimated from Strength Level’s 5th, 20th, 50th, 80th and 95th percentile points for your age and sex. It compares you with Strength Level users, not the general population.
Push-Up Standards by Age
Standards Across Age
Where You Fall in Your Age Group
The Push-Up Test
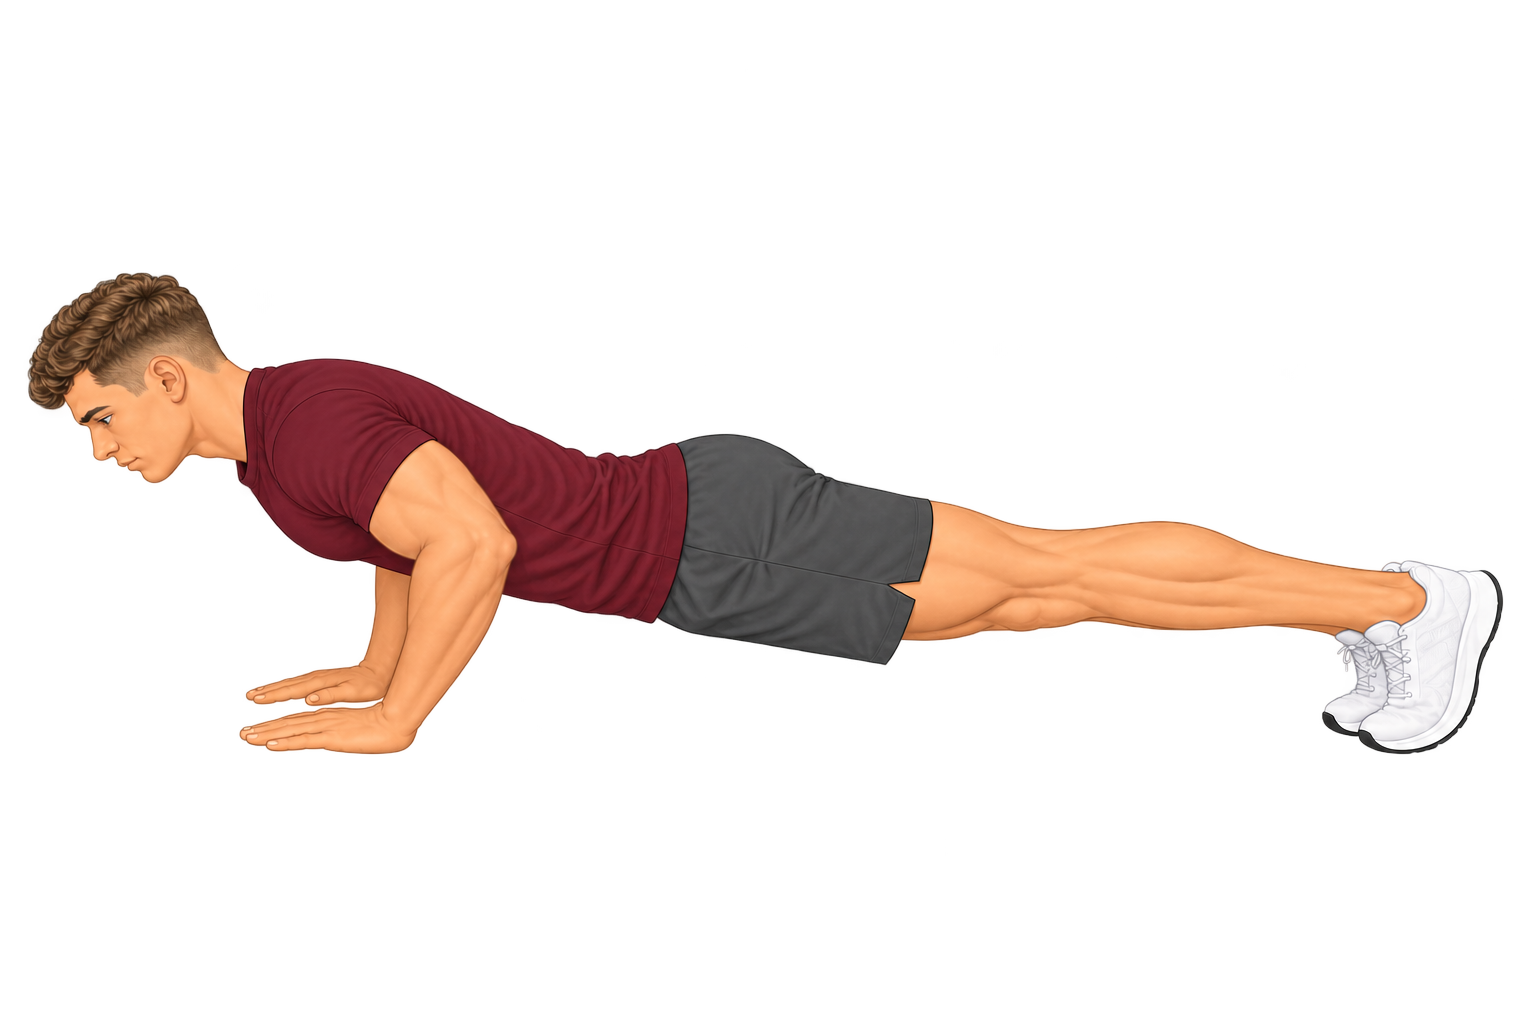
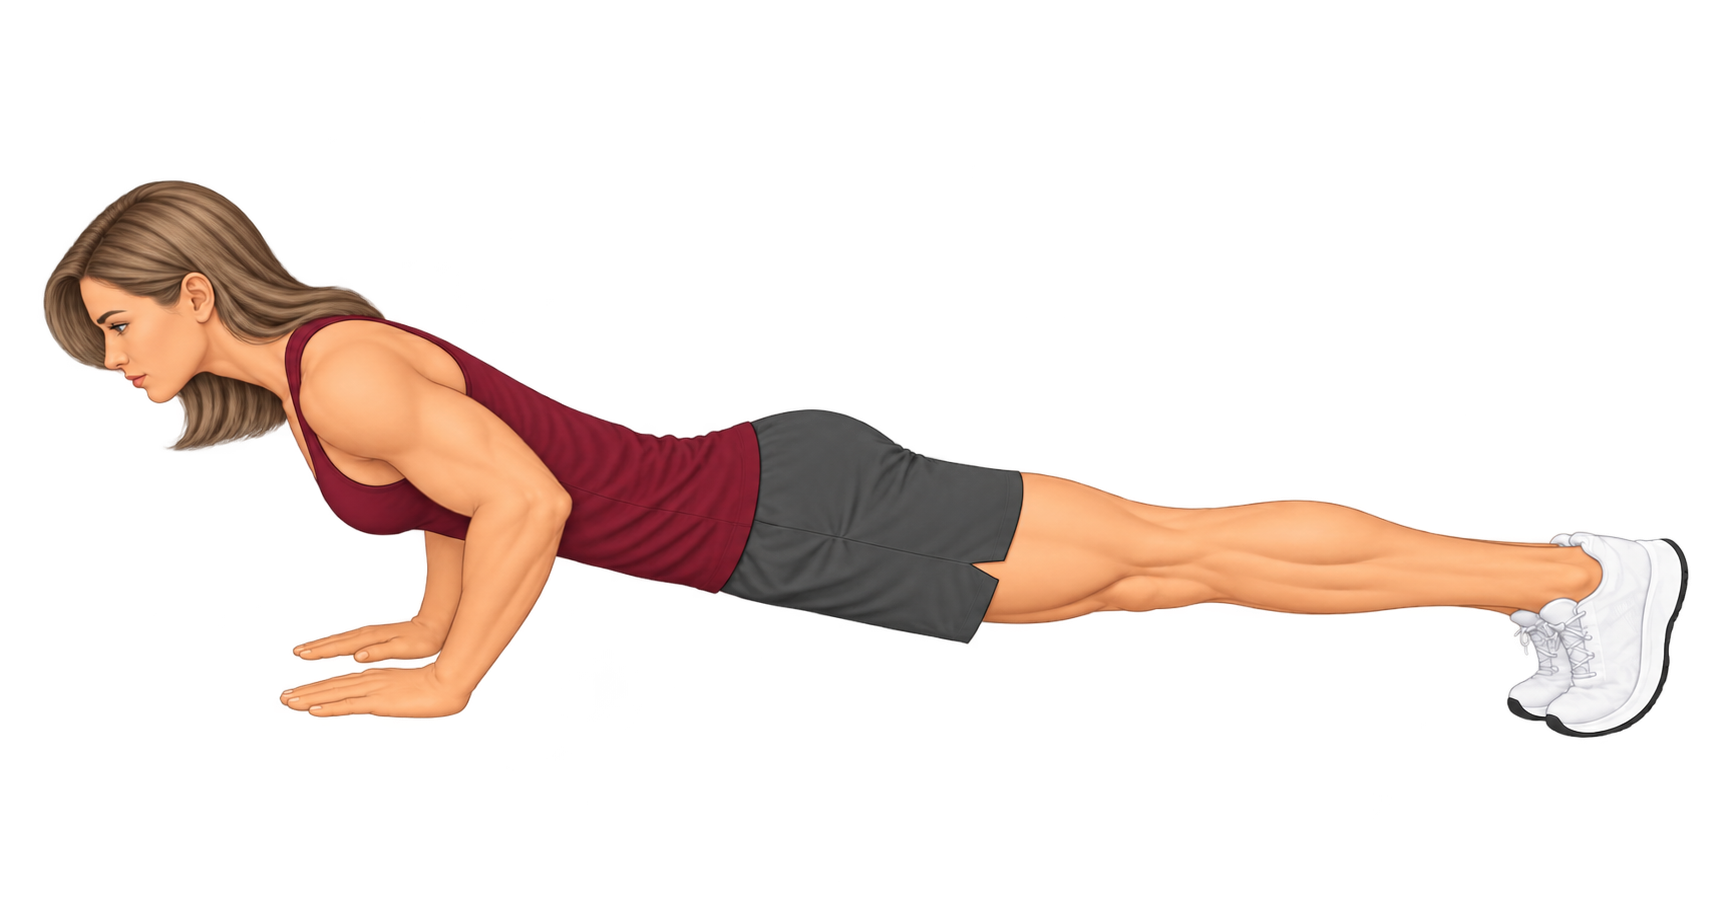
As many standard push-ups as you can in one continuous set, with no pauses and no time limit. The images below show the start, the bottom of each rep, and a rep that doesn’t count.
All three positions are shown from the side.
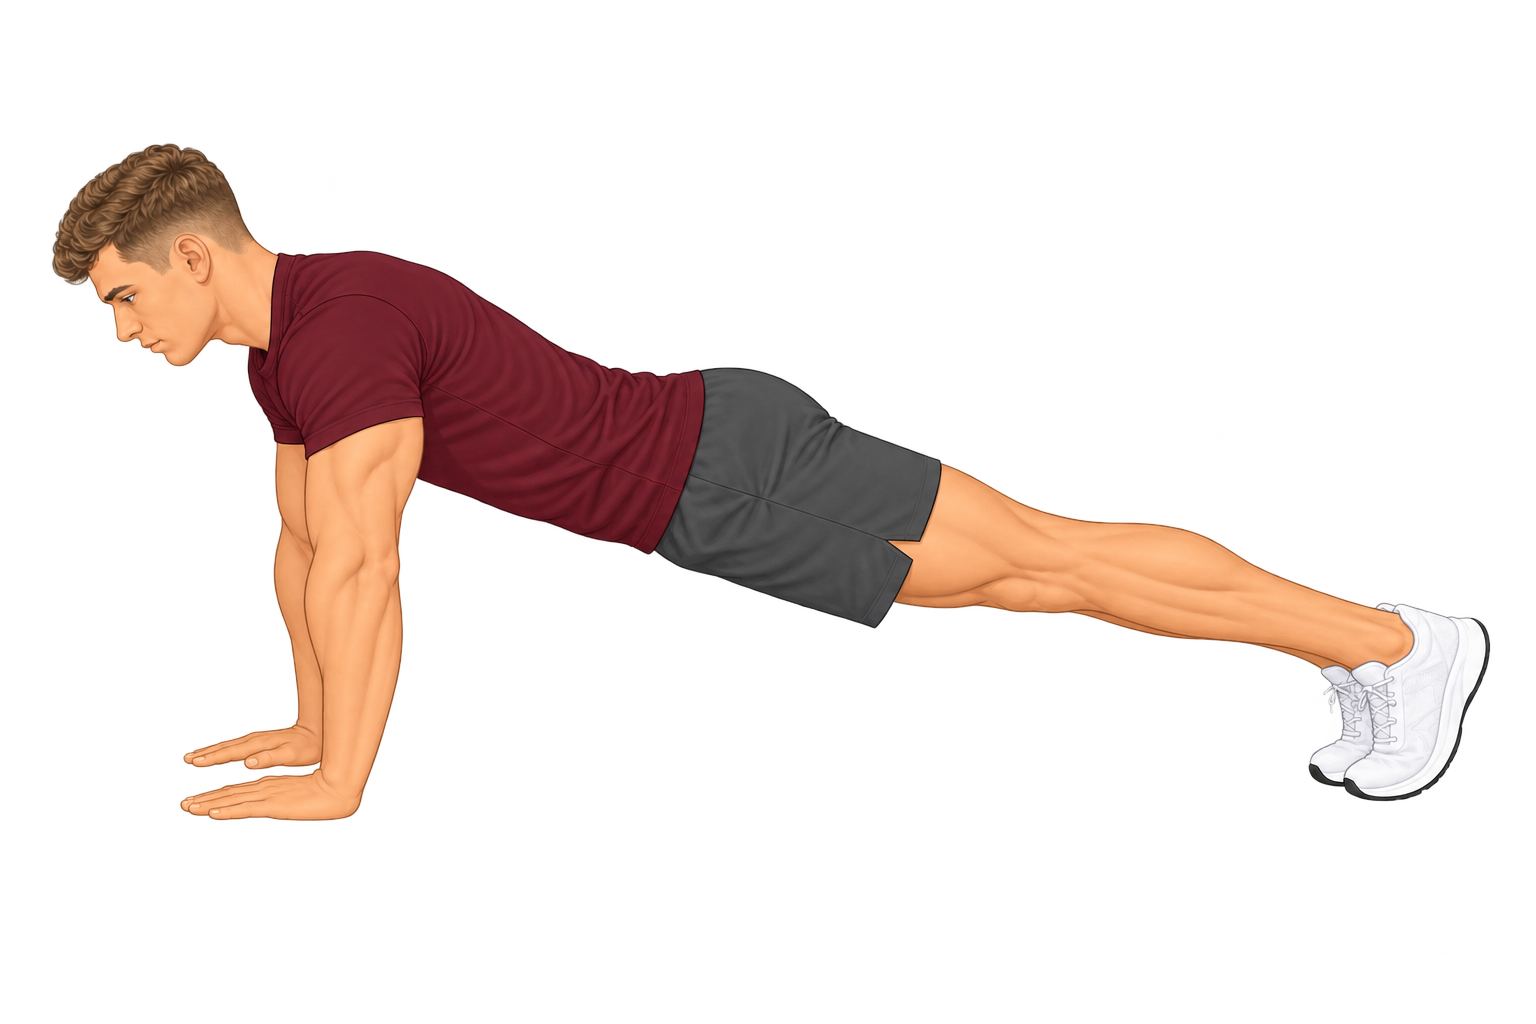
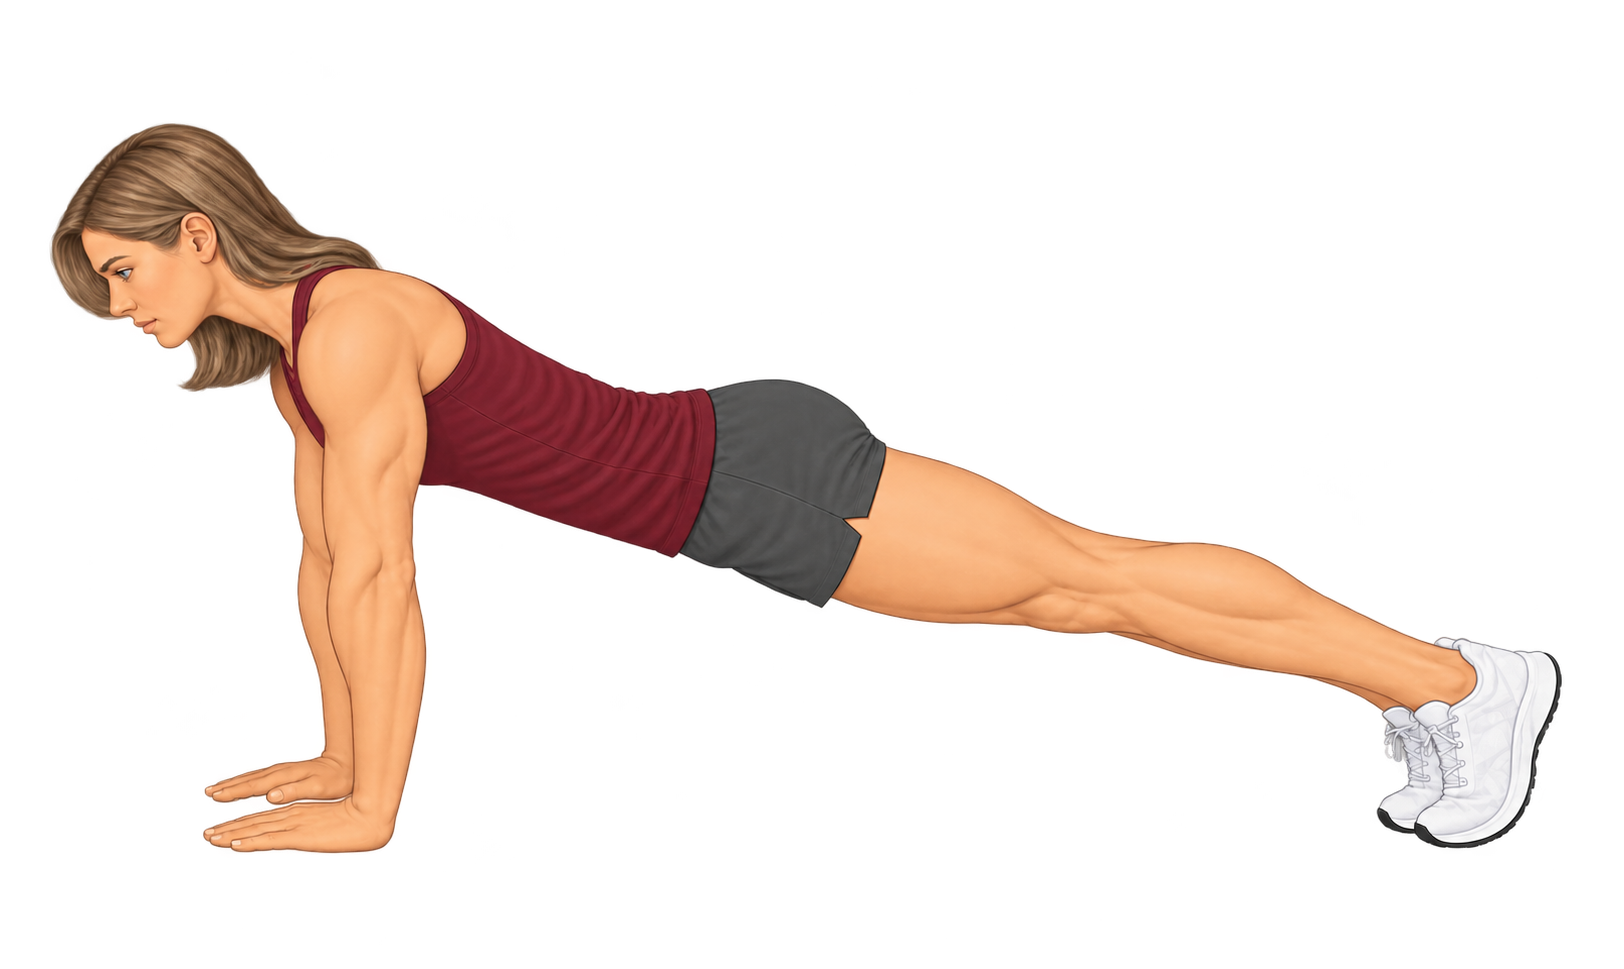
Top Position
Hands flat on the floor about shoulder-width apart, directly under the shoulders, fingers forward. Arms straight and locked, body in one straight line from head to heels, on your toes. Every rep starts and ends here.
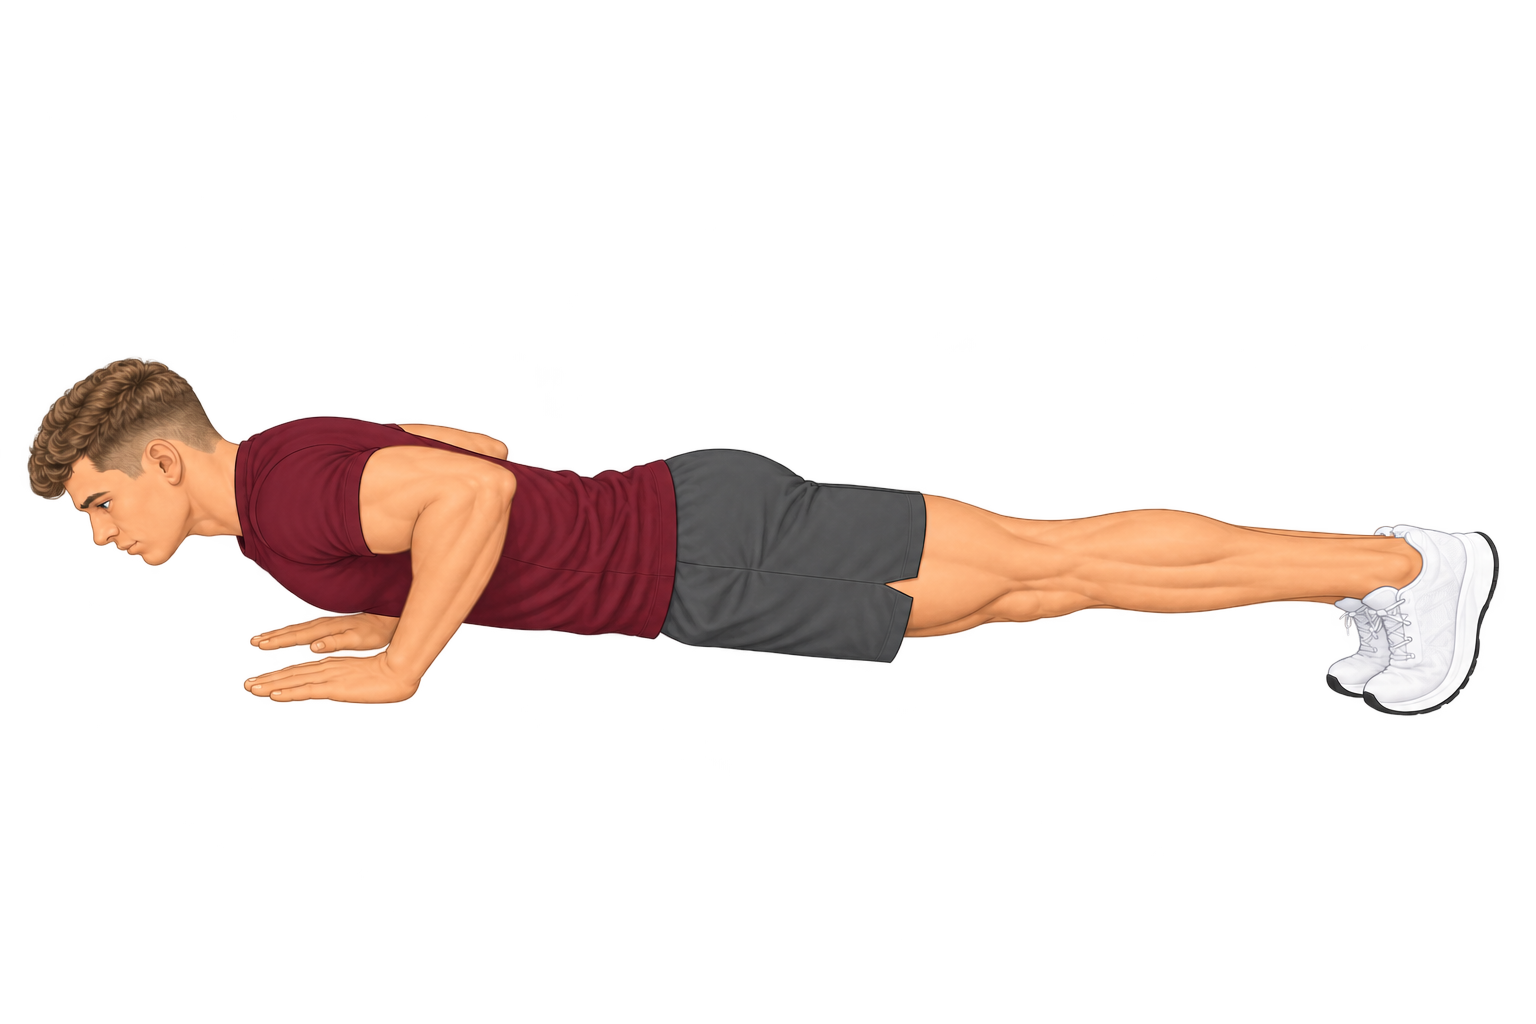
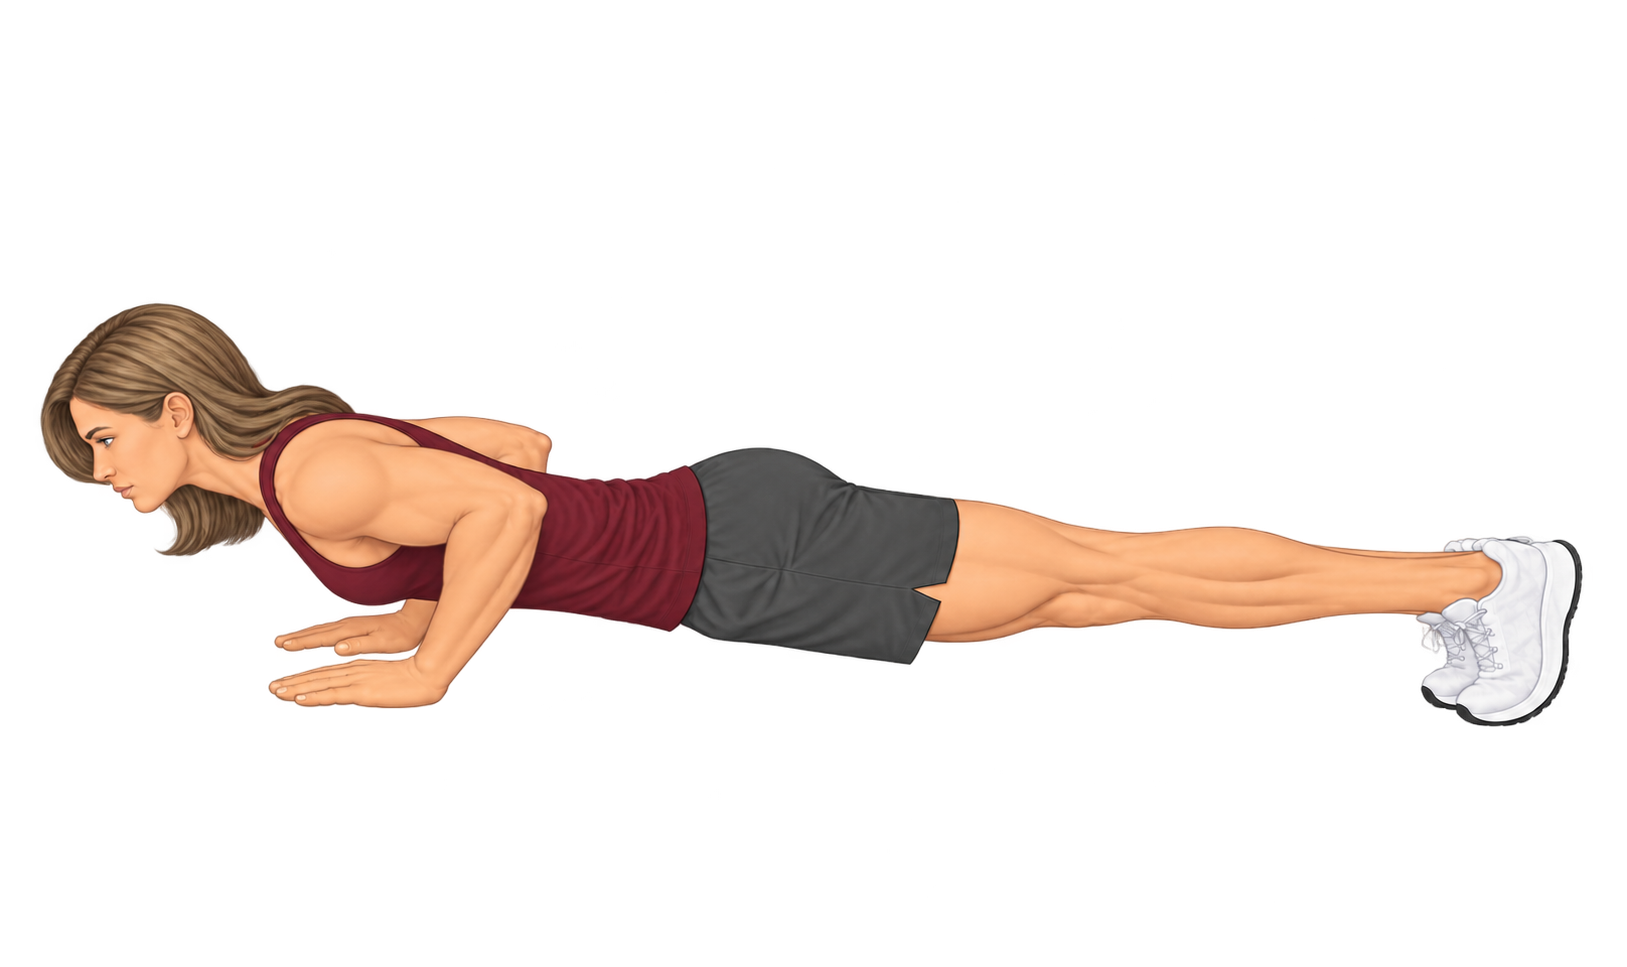
Chest Near the Floor
Lower until your chest is about a fist’s height from the floor, elbows angled back about 45° from your body. Press back up to straight arms without pausing. That is one rep.
Too Shallow
Stopping well above fist height, letting the hips sag or pike, or not pressing back to straight arms means the rep doesn’t count. The test ends at your first pause or rest, or when you can’t complete a full rep.
Warm up first, and stop right away if you feel shoulder, elbow or wrist pain. Knee and incline push-ups are different tests, so the calculator’s standards apply to this standard push-up only.
Push-Up Technique Video
A short tutorial from the National Academy of Sports Medicine (NASM) on standard push-up form: hand and foot position, a flat back, and lowering and pressing under control.
For the test: use the video for form only. The test is one continuous set of standard push-ups from the toes, with no pauses. Lower until your chest is about a fist’s height from the floor and press back to straight arms every rep. Only full reps count.
This video is from the National Academy of Sports Medicine (NASM) YouTube channel and is not produced or endorsed by Amatal. It is shown for general technique reference only and is not medical or training advice. Any products or programs mentioned in the video or its description are the creator’s own.
How This Calculator Works
This calculator measures your upper-body muscular endurance using the push-up test, one of the most widely used field assessments of muscular fitness. You enter how many standard push-ups you can complete in one continuous set, and the calculator classifies your result against Amatal’s five-tier scale for your age and sex, then computes your category, your Push-Up Age, an estimated percentile, and where you fall on a bell curve.
How These Standards Were Set
Strength Level publishes push-up rep counts at five percentile pointsThe rep counts that beat 5%, 20%, 50%, 80% and 95% of Strength Level users of the same age and sex. (5th, 20th, 50th, 80th and 95th) for every five years of age, separately for men and women. Amatal’s tiers use different cutoffs (35th, 65th, 85th and 95th), so each cutoff is placed between Strength Level’s points on a normal-curve (z-score) scale:
Each result is rounded up to a whole rep once, and those same whole numbers drive your category, the table and the chart. For ages between Strength Level’s five-year rows, values are interpolated in a straight line, so your exact age gets its own standards rather than jumping at a birthday.
The calculator covers ages 15 to 65 and does not extrapolate. Strength Level’s data goes further, but by 70 the typical woman in it logs less than one full push-up, so ratings stop at 65 for both sexes. From 55 on, at least 20% of women in the data log less than one full push-up, so the lower tiers there should be read as approximate.
Step 1: Enter Your Details
The calculator needs three inputs: your sex, your age, and the number of push-ups completed.
- SexPush-up standards are reported separately for men and women because of biological differences in upper-body muscle mass and strength-to-weight ratio. — selects which standard you are compared against.
- Age — determines the standards for your stage of life. Ages 15 to 65 are supported.
- Push-Ups Completed — your maximum standard push-ups in one continuous set, with good form.
The Test Protocol
For results that match the standards, the test must be performed the way the standards assume:
- Start position: Hands on the floor about shoulder-width apart, arms straight, body in a straight line from head to heels, supported on your hands and toes. Men and women do the same standard push-up.
- Each repetition: Lower until your chest is about a fist’s height from the floor, then press back up to fully straight arms. That is one rep.
- Continuous:Pausing at the top lets the muscles recover and inflates the count. Counting only consecutive reps also matches how CSEP’s measured test is scored. Reps must be continuous, with no pause at the top and no resting on the floor. The test ends at your first pause or rest, or when you can no longer complete a full rep with good form.
- What doesn’t count: Partial reps, sagging or piked hips, and reps that don’t reach straight arms.
Knee push-ups and incline push-ups are different tests and are not scored here.
How Your Category Is Determined
Your result is placed on the same five-tier scale used across this platform, so the push-up test reads consistently alongside the other assessments:
Low · Intermediate (35th percentile) · Advanced (65th) · Superior (85th) · Elite (95th)
Your rep count is compared against the minimum repetitions required for each tier at your age and sex, and you are placed in the highest tier you qualify for:
- Low — below the 35th percentile for your group. A clear starting point with room for improvement. Because the comparison group is gym users, many generally active people land here.
- Intermediate — around the middle of the data (35th to 65th percentile). Typical of people who train their upper body regularly. Remember the comparison group is gym users, not the general population.
- Advanced — 65th to 85th percentile. Reflects consistent upper-body training over time.
- Superior — 85th to 95th percentile. Characteristic of well-conditioned, regularly trained individuals.
- Elite — 95th percentile and above for your age and sex. Among the highest push-up counts in the demographic.
How to Read the Standards Table
The standards table lists one row for every five years of age from 15 to 65, plus an extra row for your exact age, and one column for each of the five levels. The header labels are color-coded to match the chart bands — on a phone the headers shorten to single letters (L · I · A · S · E); tap any header to see its full name.
- Each cell is a single number — the minimum. It shows the fewest push-ups needed to reach that level at that age. If your result equals or exceeds it, you’ve reached that level.
- The Low column shows a range. Low runs from zero up to one rep below the Intermediate minimum, so it is shown as a range (for example, 0–29) rather than a threshold.
- Your row and level are highlighted. The row for your exact age is shaded, and within it, the cell for your achieved level is filled with that tier’s color.
Push-Up Age
Your Push-Up AgeThe age at which your rep count would be considered typical (median) performance. Conceptually similar to "fitness age" used in cardiovascular testing. is the age at which your result would be average. If you perform more push-ups than the typical person of your actual age, your Push-Up Age is younger; if fewer, it is older.
The typical result at each age is Strength Level’s 50th-percentile rep count. In that data the typical result peaks and holds steady from 25 to 40, then declines, so Push-Up Age is read from the declining side (40 to 65). A result at or above the peak shows as ≤40, and a result below the typical 65-year-old shows as 65+. If you are under 40 and at or above the typical result for your own age, the calculator says so rather than giving you an older Push-Up Age.
Percentile Estimate
The percentile estimates the share of Strength Level users of your age and sex who log fewer push-ups than you. Your rep count is placed between Strength Level’s percentile points for your exact age (5th, 20th, 50th, 80th and 95th), on the same z-score scale used for the tiers, so the percentile always agrees with your category:
Beyond the data’s range the calculator doesn’t guess: above the 95th point it shows >95th, and below the lowest point it shows <5th (or ≤20th, for example, where that share of people log less than one full push-up).
The Bell Curve
The “Where You Fall in Your Age Group” chart draws a normal curveA bell-shaped curve that describes how results spread around an average: most people near the middle, fewer at either end. fitted to Strength Level’s percentile points for your age and sex, cut off at zero reps. The colored bands are the five tiers, and the dashed line marks your result.
Real push-up counts are whole numbers and right-skewed: a long tail of people log very high counts, and some, especially older women, can’t yet do a full push-up. A smooth bell can’t show either shape exactly, so the curve is a positioning aid. Your category and percentile come from the published points, not from the curve.
How Age and Sex Change Your Score
These two inputs do not just describe you — each one directly changes the numbers your result is measured against:
- Age changes the thresholds. The calculator recomputes the rep requirement for every tier at your exact age. Because endurance standards decline with age, the same rep count is judged against lower requirements as you get older — so an identical number of push-ups can place you in a higher tier at 55 than it would at 25. In this data the standards rise from 15 to 25, hold steady to 40, then decline, which is the shape you see in the table and chart.
- Sex selects a different table. Choosing male or female swaps in Strength Level’s separate men’s or women’s data. Both are for the same standard push-up, but the rep counts required for each tier differ, so the same number of push-ups is scored differently depending on which table applies.
Why Muscular Endurance Matters
Push-up capacity is more than a gym benchmark. A 2019 study of 1,104 male firefighters in Indiana (average age about 40) followed them for about ten years. Men who completed more than 40 push-ups at the start had a 96% lower rate of cardiovascular events than men who completed fewer than 10, and men completing 11 or more also had lower risk. In that group, push-up capacity was more strongly associated with cardiovascular events than the treadmill test estimates were.
Important context: that study used a different protocol, push-ups in time with a metronome at 80 beats per minute, so its 40-rep mark doesn’t translate directly to this max test. It included men only, from an active occupation, and recorded 37 cardiovascular events in total. It shows an association, not proof that push-ups themselves prevent disease. Still, muscular endurance is a meaningful marker of overall functional fitness, and it tends to move alongside broader health and conditioning.
Data Sources and Verification
The push-up standards come from Strength Level’s community data. The other references provide the measured comparison, the protocol and the health context:
- Strength Level — Push Ups Standards (strengthlevel.com/strength-standards/push-ups). By-age rep standards for men and women, built from 875,653 qualifying results (776,543 male, 99,110 female) logged by users; retrieved October 30, 2026. Source of all thresholds, the percentile estimate, Push-Up Age and the bell curve on this page. Mapped to Amatal’s tier cutoffs; Amatal uses its own tier names.
- Canadian Society for Exercise Physiology (2019). CSEP Physical Activity Training for Health (CSEP-PATH) Resource Manual (2nd ed.). Ottawa: CSEP — measured push-up health-benefit ratings by age and sex (men from the toes, women from the knees), also reprinted in ACSM’s Guidelines for Exercise Testing and Prescription. Used here as a comparison only.
- Heyward, V.H., & Gibson, A.L. (2014). Advanced Fitness Assessment and Exercise Prescription (7th ed.). Human Kinetics — push-up testing protocol and interpretation of muscular-fitness field tests.
- Yang, J., Christophi, C.A., Farioli, A., et al. (2019). Association Between Push-up Exercise Capacity and Future Cardiovascular Events Among Active Adult Men. JAMA Network Open, 2(2):e188341 — source of the cardiovascular-association finding.
Limitations and Important Caveats
This calculator provides an estimate, not a clinical measurement. Several factors affect how precisely it reflects your true muscular endurance:
- Self-selected, self-reported data. This is the most important caveat. Strength Level’s data comes from people who log their training online, mostly regular gym-goers, and results aren’t verified for form. Push-up counts are especially easy to inflate with shallow reps. Treat your category, Push-Up Age, and percentile as guidance, not clinical norms.
- Smaller women’s sample. The women’s standards rest on about 99,000 results, compared with about 777,000 for men.
- Low results are imprecise. Strength Level reports anything under one rep as “<1,” so the lowest points are less precise, especially for women from 55 on.
- Modeled steps. The 35th, 65th and 85th percentile cutoffs are placed between Strength Level’s published points on a normal-curve scale, and ages between its five-year rows are interpolated. Ratings cover ages 15 to 65 only.
- Form and tempo. Depth, a straight body line, full lockout, and no pausing all change the count. Inconsistent form is the largest source of error in self-administered push-up tests.
- Body weight and leverage are not scored. Limb length, body weight, and proportions change how hard each push-up is. Strength Level publishes no combined age-and-bodyweight table, so this calculator scores by age and sex only.
- Single-test snapshot. Fatigue, sleep, time of day, and recent training all affect a single test. For tracking progress, retest under the same conditions every few weeks.
Disclaimer:
This calculator provides an estimate based on Strength Level’s self-logged community data, mapped to Amatal’s tiers; it does not use validated clinical norms. Real muscular endurance depends on training history, technique, body weight and proportions, recovery, and individual variation. Always warm up before any fitness test and stop immediately if you experience pain, dizziness, or unusual discomfort. This tool is for general informational purposes only and should not be considered medical, fitness, or training advice. Consult a healthcare provider before beginning a new exercise program, especially if you have a pre-existing condition, are over the age of 45, or have been sedentary for an extended period.