How the Functional Reach Test Calculator Works
The Functional Reach Test (FRT) measures dynamic balance — how far you can shift your weight toward the edge of your stability while standing still. You stand side-on to a wall and reach as far forward as you can with one arm, without stepping or losing balance. The distance your hand travels reflects how far you can move your centre of mass over your feet and still stay in control — your
limits of stabilityThe maximum distance you can lean in a direction before you must step or fall to keep from toppling. Larger usually means better balance control..
It was developed by Pamela Duncan and colleagues at Duke University in 1990 as a quick, low-cost clinical measure of balance and an early fall-risk screen, and it has been used ever since as a marker of balance and physical frailty in older adults. All it needs is a yardstick on a wall.
Step 1: Set Up and Measure
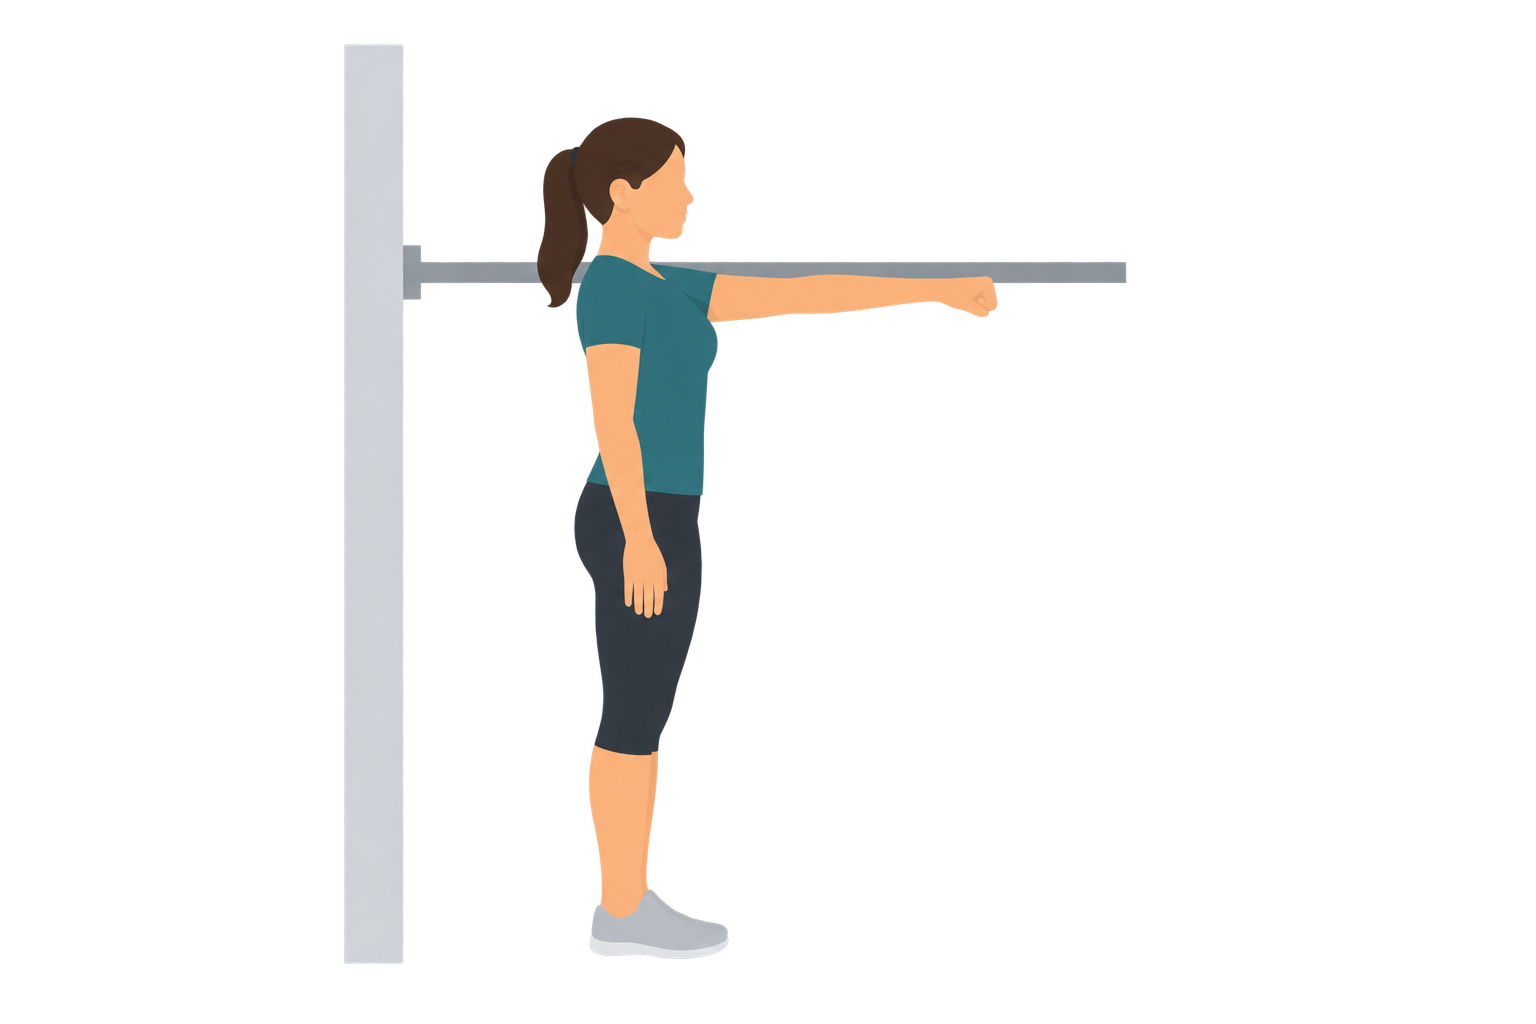
- Stand close to a wall (not touching), side-on, with a yardstick mounted at shoulder height.
- Raise the arm nearest the wall to shoulder level, make a fist, and note where your knuckles
(the third knuckleThe head of the third metacarpal — the middle knuckle — is the standard landmark read against the yardstick.)
line up on the yardstick. That is your start position.
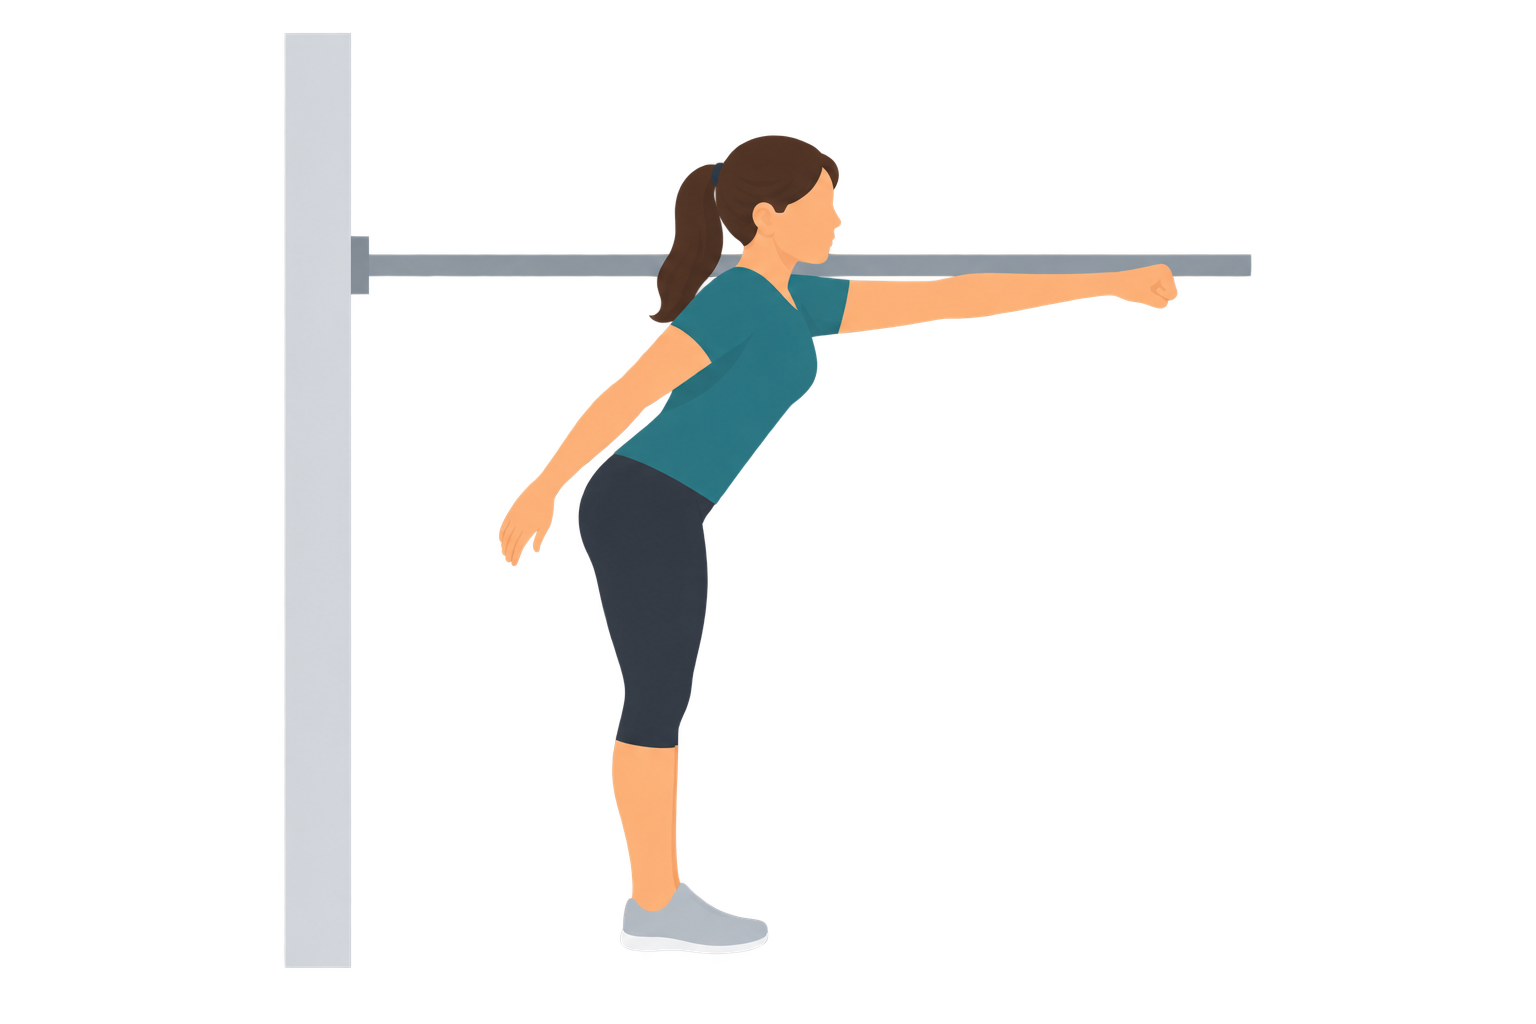
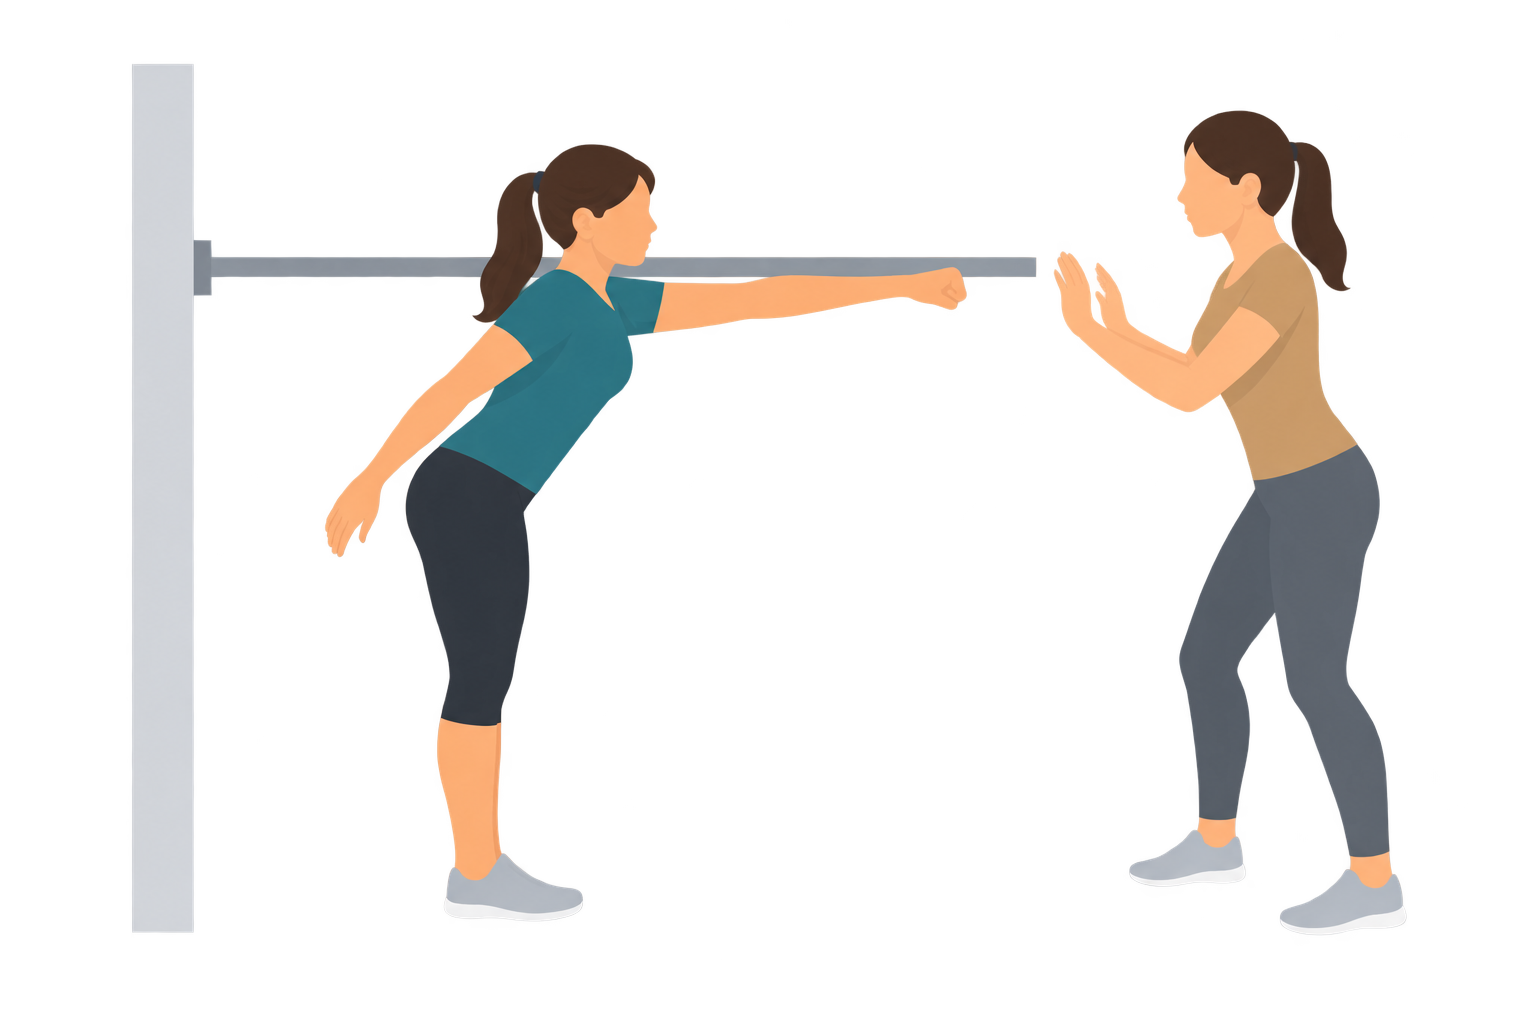
- Reach as far forward as you can without taking a step, lifting a heel, or touching the wall, then note where your knuckles end up — your end position.
- Take three trials and use the average of the last two; a practice trial first helps.
Step 2: Your Reach Distance
Your score is simply the distance the hand travelled:
Functional reach = end position − start position
A larger reach means you can carry your body further over a fixed
base of supportThe area beneath and between your feet. Balance is about keeping your centre of mass over this area; reaching pushes it toward the edge.
while staying balanced. The calculator works in centimetres or inches — whichever you choose — and reads your number two different ways.
Step 3: Two Ways to Read It
Fall-risk bands. The reach is first checked against fixed cut points drawn from research on older adults:
- High fall risk — under 6 inches (about 15 cm). In the validation work, reaching less than this was linked to roughly four times the fall risk; being unable to reach at all, about eight times.
- Moderate fall risk — 6 to 10 inches (about 15–25 cm). An intermediate level.
- Lower fall risk — more than 10 inches (about 25 cm).
Age- and sex-matched norms. The calculator also compares your reach to the average for your age and sex, so you can see whether you are above or below typical — a more useful read than the fixed bands for anyone who isn’t an older adult.
Why the Thresholds Are Age-Sensitive
The 6-inch and 10-inch cut points were established in older adults (the predictive work was done in elderly men), where a short reach genuinely flags risk. For a healthy younger adult they say almost nothing — a typical reach in your twenties is 16–17 inches, well past the “lower risk” line, so clearing it is automatic. That is why, for anyone under about 60, the calculator points you to the age/sex comparison as the meaningful result and treats the risk bands as context rather than a verdict.
A Note on Sex
Duncan’s original 1990 data reported separate averages for men and women, and the calculator uses those. A later systematic review, however, found that sex did not meaningfully affect Functional Reach scores — differences by setting (whether someone lives independently or not) mattered far more. The original sex-specific norms are kept here because they remain the most age-detailed published reference, but it is fair to read the male/female difference as small and uncertain.
Reading the Gauge and the Norms Table
- Where You Fall (gauge) — a single scale with the three risk zones coloured in, your reach marked below the bar and the age/sex average marked above it, so you can see both readings in one place.
- Reference Norms by Age — the average reach for each age group in your sex, with your group highlighted, showing how reach declines across the lifespan.
What Affects Your Reach
- Body proportions — Longer arms and greater height add reach independent of balance, which is one reason the test is read against age and sex norms rather than as an absolute.
- Flexibility and strength — Trunk and hip mobility and the strength to control the lean both feed into how far you can go.
- Strategy — Reaching by bending forward at the hips reaches further than simply rotating the shoulder; consistent technique matters for comparing over time.
- Confidence — Fear of falling shortens reach, so anxiety on the day can lower the score independent of true balance.
Data Sources
- Duncan PW, Weiner DK, Chandler J, Studenski S (1990). “Functional reach: a new clinical measure of balance.” Journal of Gerontology, 45(6):M192–197 — the test and the age/sex normative averages used here (n = 131, ages 21–87).
- Duncan PW, et al. (1992); Weiner DK, et al. (1992). Predictive-validity and frailty studies in older adults — source of the standing protocol and the fall-risk associations behind the 6-inch and 10-inch cut points.
- Systematic review & meta-analysis (2018). Pooled Functional Reach data confirming that scores fall with age, that sex did not significantly affect results, and that the test should not be used on its own to predict falls.
Limitations and Important Caveats
- It is a screen, not a prediction. A pooled review concluded the Functional Reach Test should not be used on its own to predict falls; clinicians pair it with other balance and mobility tests.
- It only measures forward reach. Balance is multi-directional; reaching forward says little about sideways or backward control. (Extended versions add other directions.)
- Norms are for ages 20 and up. They don’t cover children or adolescents, and the cut points are weakest at the young end of the range.
- Setup and technique matter. A different start position, a lifted heel, or a sit-down (modified) version all change the number; results are most meaningful when the method is consistent.
- One moment in time. A single reach is a snapshot; a trend across sessions is more informative, especially during training or rehab.
Disclaimer:
This calculator scores the Functional Reach Test against published reference data and fall-risk thresholds. It is for general informational and screening purposes only and is not a medical assessment, a diagnosis, or a prediction of falls. Always test in a safe space with a wall or sturdy support in front of you and someone nearby to guard, and stop if you feel unsteady. The fall-risk thresholds were established in older adults and should not, on their own, drive conclusions about your balance — a “lower risk” result does not guarantee safety, and a flagged result does not confirm a problem. If you have balance concerns, dizziness, frailty, or a history of falls, consult a qualified healthcare provider. This tool does not replace professional assessment.