
Flamingo Balance Test Calculator
Eurofit static-balance norms for ages 9–17
Reference Norms by Age
Where You Fall, by Age
The Flamingo Position
Learn the correct stance first, then what counts as a fall while you hold it.
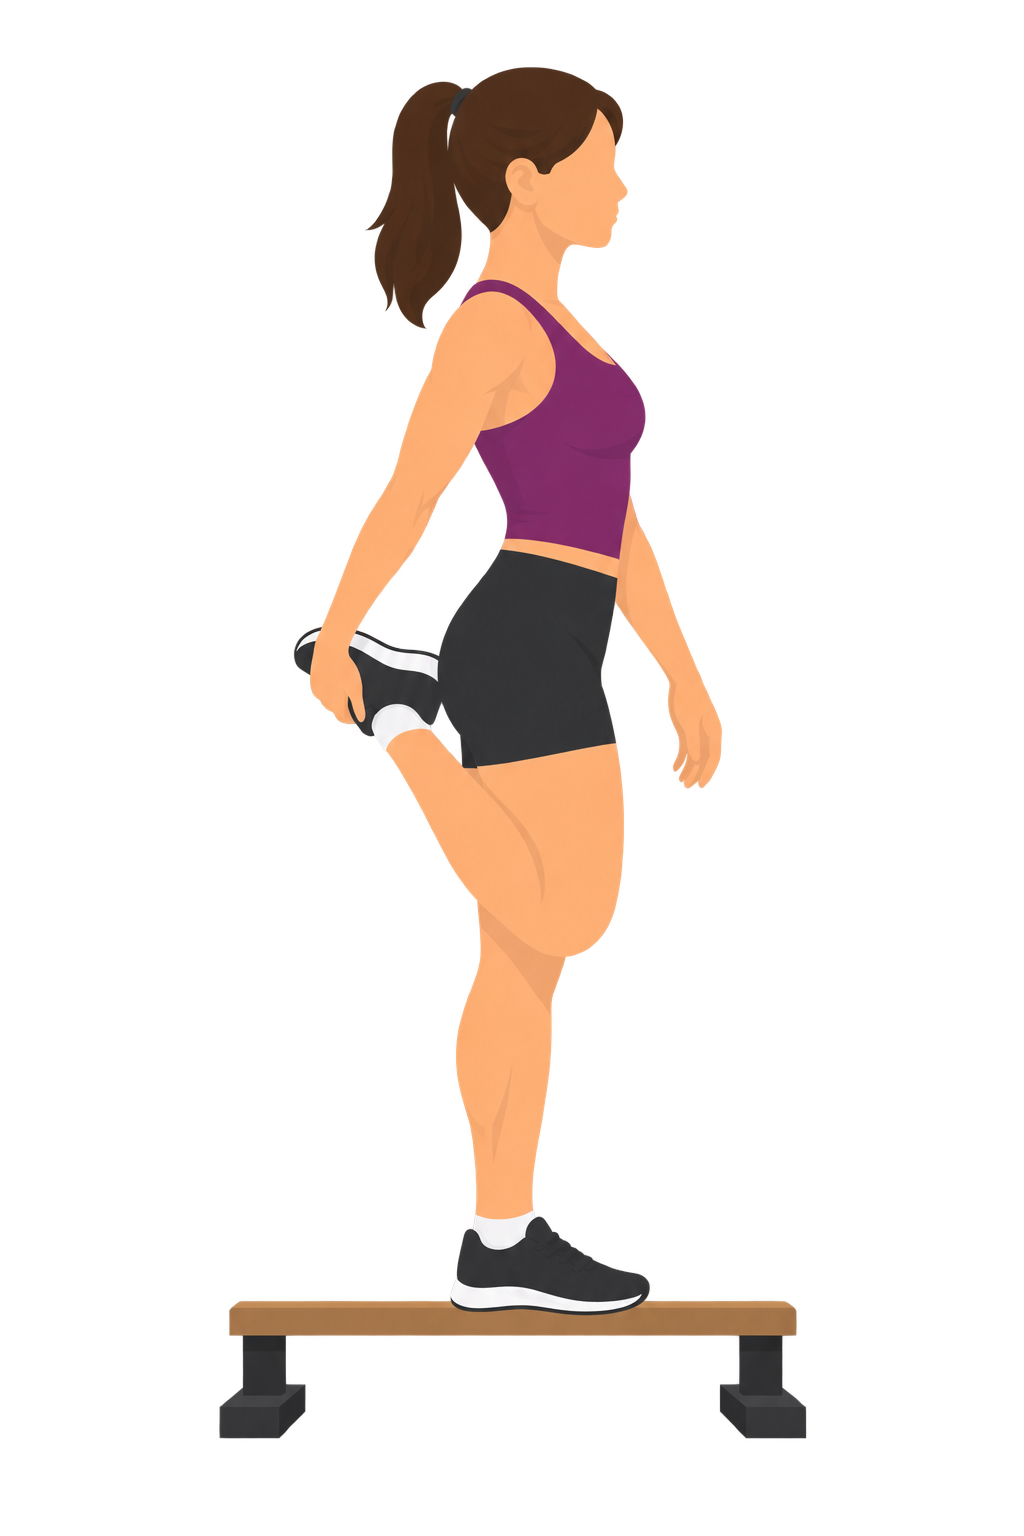 Correct Position
The Hold
Stand on your preferred leg on the beam. Bend the free leg behind you and hold that foot with the hand on the same side. Your other arm is free for balance. Start the clock once you're set, and hold for 60 seconds.
Each time balance is lost counts as one fall. The clock pauses, you reset, and keep going until 60 seconds have passed. Any of these ends a hold:
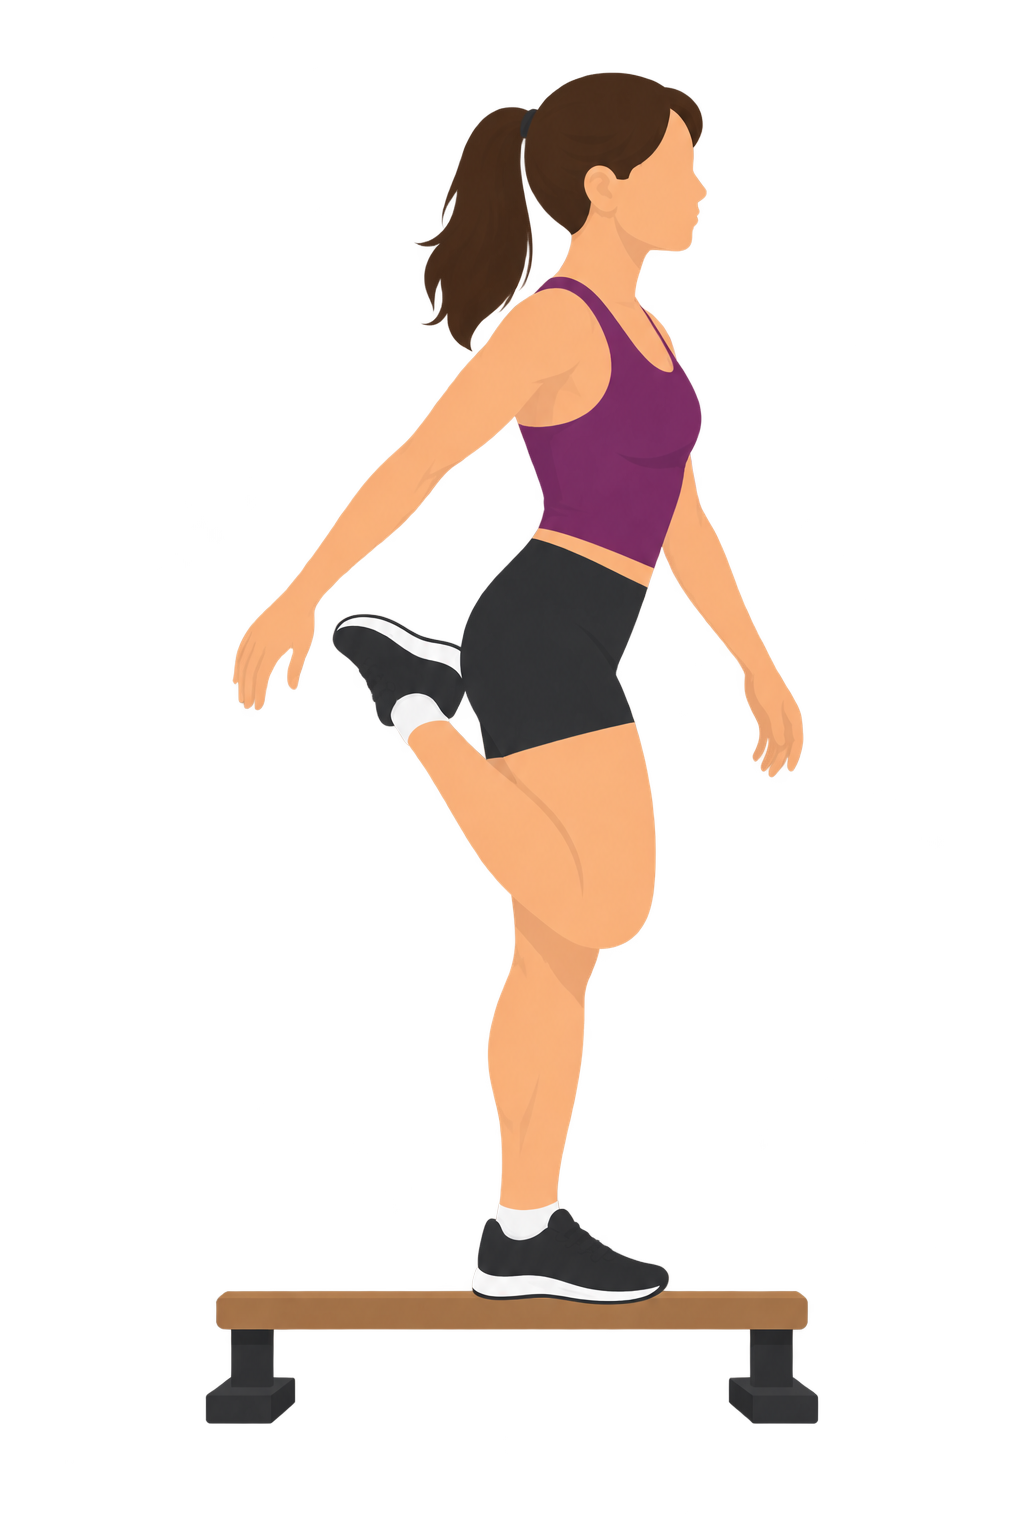 Fall
Fall
Grip released
Your hand lets go of the held foot.
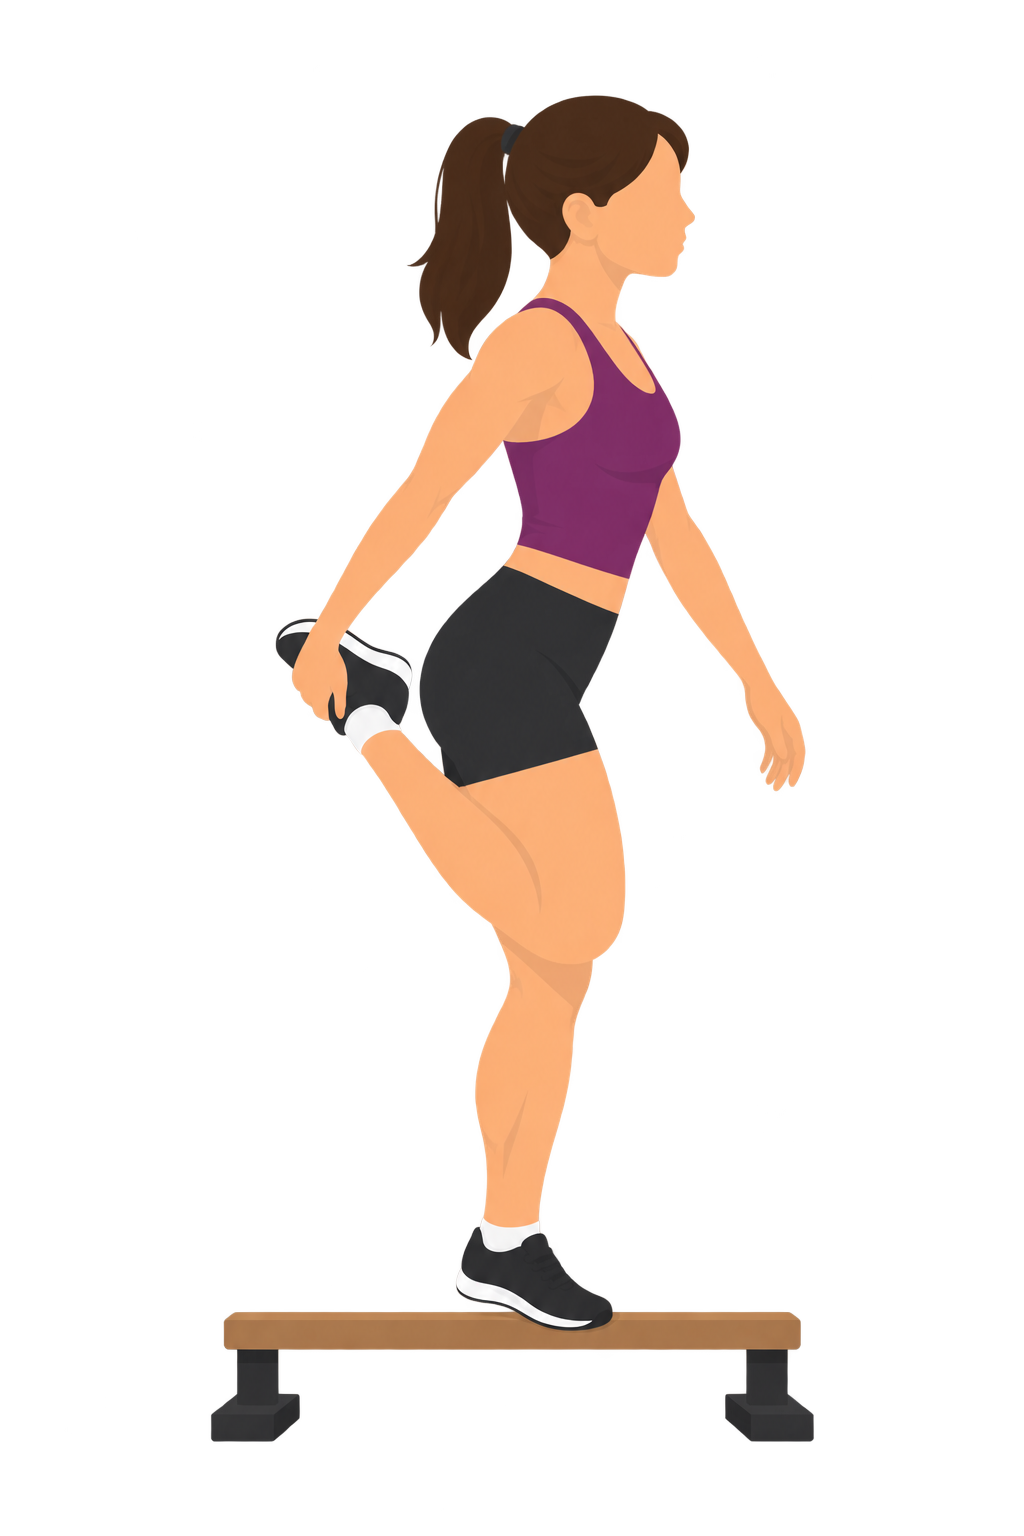 Fall
Fall
Standing foot moves
Your support foot shifts on the beam.
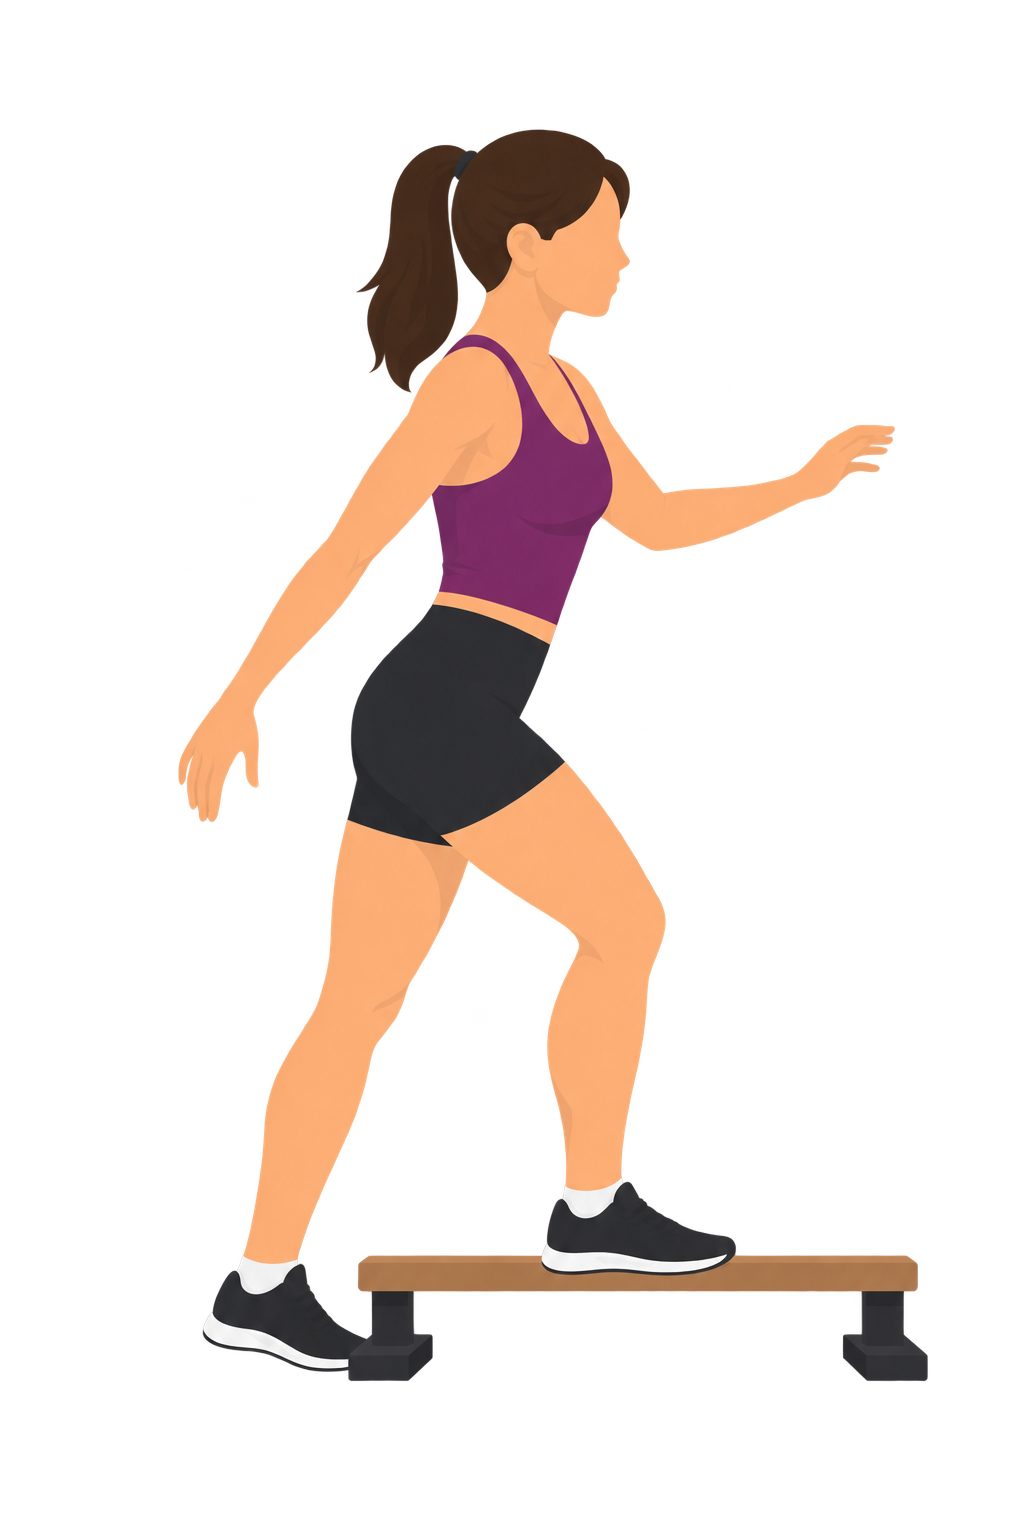 Fall
Fall
Body touches down
Any part of you touches the ground.
Based on the Eurofit standard protocol. Keep the setup, surface, and footwear consistent between tests so your fall counts are comparable over time.
The Test in Practice
A short Eurofit demonstration of the beam setup, the flamingo hold, and how falls are counted.
Video is external and not produced by Amatal. Follow the written protocol above where the two differ — in particular, the free foot is held by the hand on the same side, and a fall is counted whenever the grip is released, the standing foot moves, or any part of the body touches the ground.
- Single-Leg Stance — the adult analog of this test: how long you can hold one-leg balance, rather than counting falls.
- Y-Balance Test — dynamic balance and reach in three directions while standing on one leg.
- Timed Up and Go — a mobility and fall-risk screen: stand, walk, turn, and sit against the clock.
How the Flamingo Balance Test Calculator Works
The Flamingo Balance Test is the balance item in the EurofitA standardized battery of nine physical-fitness tests developed by the Council of Europe in 1988 and used in schools across more than 30 countries. fitness battery. It measures static balanceThe ability to hold a fixed position steadily, without the corrective movement that dynamic balance involves. by counting how many times you lose balance while standing on one leg on a narrow beam for 60 seconds. This calculator takes that count and compares it to large European reference data for your age and sex, then rates it on a five-band scale.
Because the score is a count of balance losses, fewer falls means better balance — the scale runs the opposite way to a timed test, where holding longer is better. The norms come from a pooled analysis of 123,655 children and adolescents aged 9 to 17 (Tomkinson et al., 2018).
Step 1: Perform the Test
The test uses a Eurofit balance beam — 50 cm long, 4 cm high, and just 3 cm wide. Standing on the beam:
- Stand lengthwise on the beam on your dominant (preferred) leg.
- Bend the free leg at the knee and hold that foot behind you, close to your buttocks, gripped by the hand on the same side — the “flamingo” position. Your other arm is free for balance.
- The timer starts when you lift the free foot, and runs for a total of 60 seconds of balancing.
- Each time you lose balance — you release your grip on the held foot, the standing foot moves on the beam, or any part of your body touches the ground — counts as one fall. The clock pauses while you reset, then continues.
- Your score is the total number of falls in the 60 seconds. Take one practice attempt first.
If balance fails more than 15 times in the first 30 seconds, the test is stopped and recorded as a very low score — a sign the task is currently too difficult to measure meaningfully.
Which leg, and comparing both. The standardized test — and the reference data — uses the preferred (dominant) leg, so that is the leg the calculator rates. You can optionally test the other leg too and enter it for a side-to-side comparison: the calculator will tell you which leg was steadier and by how much. Because published norms exist only for the preferred leg, the other leg is reported as a raw comparison and is not given a percentile or band. Some difference between legs is normal, and there is no validated asymmetry cut-off for this test, so a large or repeatable gap is best read as a prompt to look closer rather than a result on its own.
Step 2: The Score Runs Backwards
On most fitness tests a bigger number is better. Here it is the reverse: each fall is a slip of balance, so a lower count is a better result. A score of 0 means you held the full 60 seconds without a single loss; a score in the teens or twenties means balance was lost often. Every part of this calculator — the rating, the percentile, and the chart — is built around that “fewer is better” direction.
Step 3: Compare to Age- and Sex-Matched Norms
Your fall count on its own doesn’t mean much until it is placed against what is typical for someone your age and sex. The calculator does this using centilesA centile (or percentile) marks the score below which a given share of the group falls. A score at the 25th centile is one that 25% of children score at or below. from the reference data, and reports an approximate balance percentile — the share of children your age and sex you balanced better than.
The Five Rating Bands
Your result is sorted into one of five bands, read from the “few falls” end of the scale:
- Well Above Average — among the steadiest for your age and sex (about the top 5%, the fewest falls).
- Above Average — better balance than roughly three-quarters of your peers.
- Average — the middle half of children your age and sex; a normal, typical result.
- Below Average — more falls than most peers.
- Well Below Average — among the most falls for your age and sex (about the bottom 5%).
Why Age and Sex Both Matter
- Age — Balance keeps developing through childhood and adolescence, and scores improve gradually across the 9-to-17 range. A 9-year-old and a 17-year-old are therefore measured against different yardsticks, with a separate norm for each year of age.
- Sex — In this dataset, girls record slightly fewer falls than boys at most ages, with the gap largest around 9 to 14 and narrowing by the later teens. Because that difference is present in the reference data, boys and girls are scored against their own norms. (This is different from the adult single-leg stance test, where balance did not differ meaningfully by sex.)
The Floor Effect
The best balancers in this age range can stand almost perfectly, and the test simply runs out of room to tell them apart — a score of around three falls already sits near the top of the scale at nearly every age. So the calculator does not try to rank the very steadiest against one another: once you reach that floor, you are flagged as among the best, without a finer placement the data can’t support. It is a real limit of the test, not of your balance.
Reading the Chart and the Norms Table
- Reference Norms by Age — the published centiles (best, 25th, median, 75th, and lowest-typical) for each age in your sex, with your age highlighted, so you can see how typical scores shift across the years.
- Where You Fall, by Age — a chart of those centile bands across ages 9 to 17, with the median drawn as a dashed line and your result marked as a dot. The vertical axis is flipped so that higher on the chart means better balance (fewer falls), which keeps it reading the intuitive way even though the underlying score goes the other direction.
A Youth-Only Test
The norms here cover ages 9 to 17 only, because that is the population the Eurofit reference data describes. There is no comparable large-sample adult dataset for the Flamingo test, so it should not be used to rate adult balance. For adults, a timed single-leg stance — how many seconds you can hold the position — is the more established measure.
Data Sources
- Tomkinson GR, Carver KD, Atkinson F, et al. (2018). “European normative values for physical fitness in children and adolescents aged 9-17 years: results from 2,779,165 Eurofit performances representing 30 countries.” British Journal of Sports Medicine, 52(22):1445–1456. The Flamingo centiles are drawn from 123,655 test performances and were modeled with the LMS method.
- Eurofit (Council of Europe, 1988) — the original handbook defining the test protocol and equipment.
- A note on the centiles: the source paper reports the 10th, 20th, 30th, 70th, 80th, and 90th centiles directly. The 25th and 75th shown here are interpolated from those, and the 5th centile reflects the floor effect described above. Treat the band edges as close approximations rather than exact cut-offs.
Limitations and Important Caveats
This calculator rates a single short balance task against reference data. It cannot capture everything that affects balance or performance:
- Test reliability — The Flamingo test has more modest repeat-test reliability than some other Eurofit items, so any single result is best treated as a rough indicator. A trend across several tests is far more meaningful than one score.
- Testing conditions — Beam quality, surface, footwear, fatigue, focus, and how strictly falls are counted all shift the result. A consistent setup matters for fair comparison over time.
- It is a screen, not a diagnosis — A low score flags balance that is below average for age; it does not identify a cause. Persistent or unusual difficulty is best assessed by a professional.
- Population — The norms describe European children and adolescents and may not perfectly represent every background or setting.
- Age range — Results are only valid for ages 9 to 17; the tool should not be used to judge adult balance.
Disclaimer:
This calculator rates the Flamingo Balance Test against published European reference data for children and adolescents aged 9 to 17. It is for general informational and fitness-tracking purposes only and is not a medical, developmental, or diagnostic assessment. Always test in a safe space — the beam on a non-slip surface with room to step off, and supervision for younger children. A result on this test reflects one short task on one day and should not be used on its own to draw conclusions about a child’s balance or development. If you have concerns about balance, coordination, motor development, or a history of falls or injury, consult a qualified healthcare provider. This tool does not replace professional assessment.