
Plank Hold Test
Core (Trunk) Muscular Endurance
Forearms under your shoulders, body straight from head to heels. The timer stops when your hips sag or rise.
Stop the timer the moment your hips sag or rise or your form breaks, and stop right away if you feel back pain.
Age-20 standards come from Strand et al. (2014), a study of college students. Standards for other ages are Amatal estimates from a modeled age curve, not measured data.
Retest every 4–6 weeks with the same protocol and compare against your own previous time. That comparison is the most reliable result on this page.
Estimated from Amatal’s modeled age curve, not from measured plank data at each age.
Based on Strand et al.’s 10th–90th percentile times, scaled to your age with the estimated age curve. Results outside that range show as <10th or >90th.
Plank Standards by Age
Standards Across Age
Where You Fall in Your Age Group
The Plank Hold Test
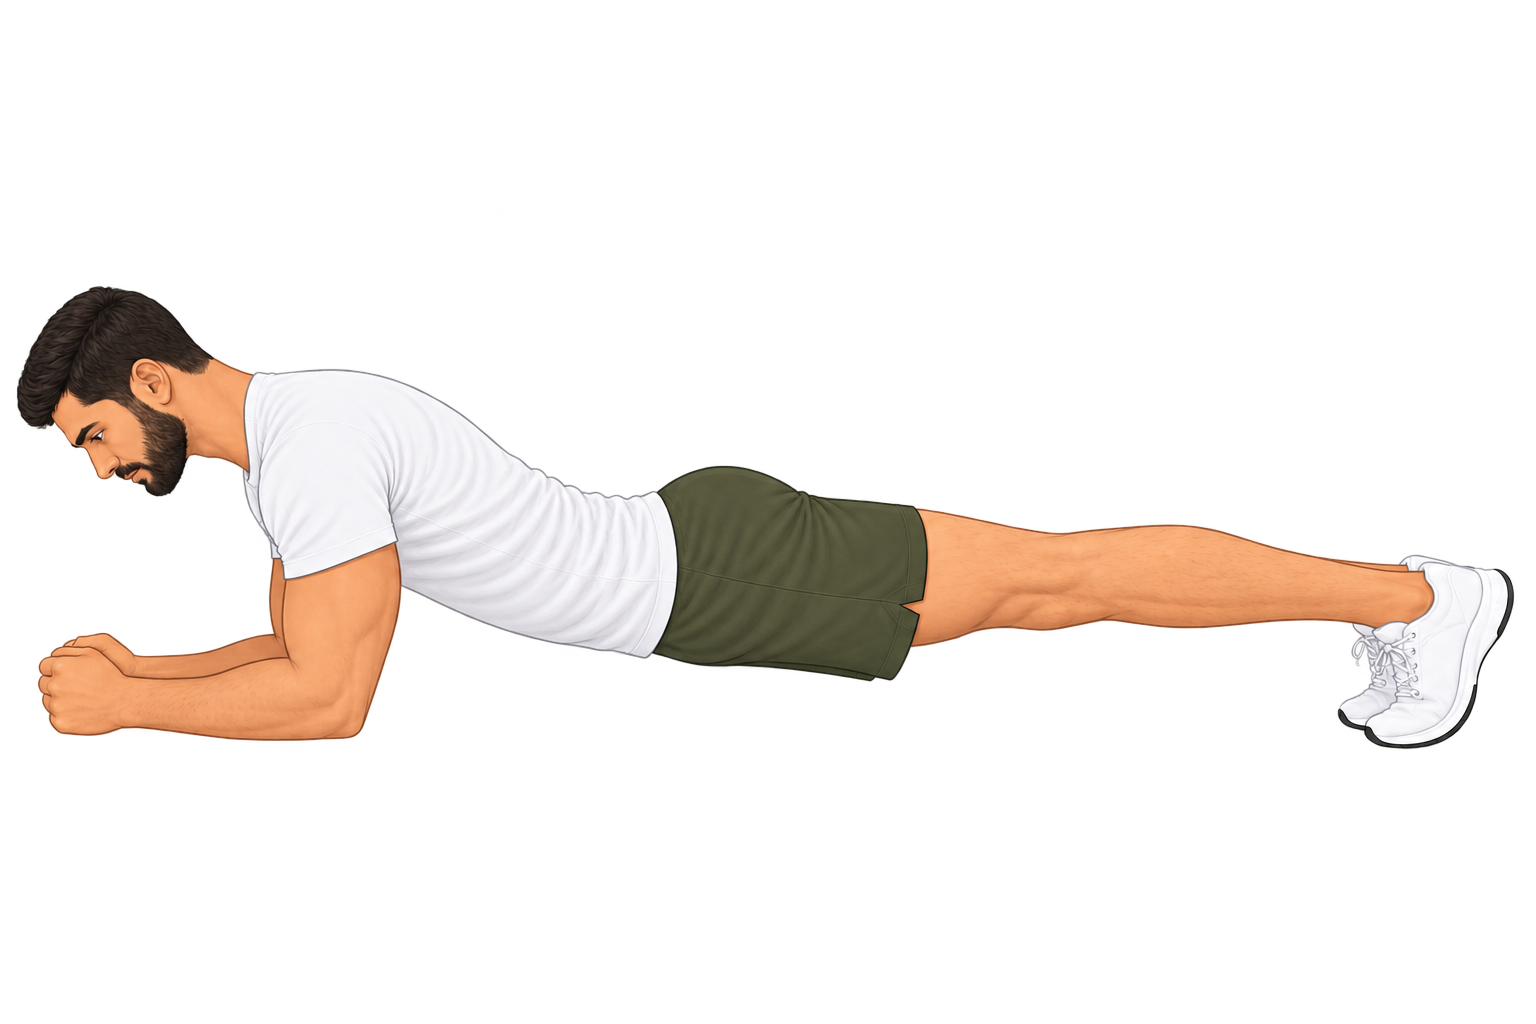
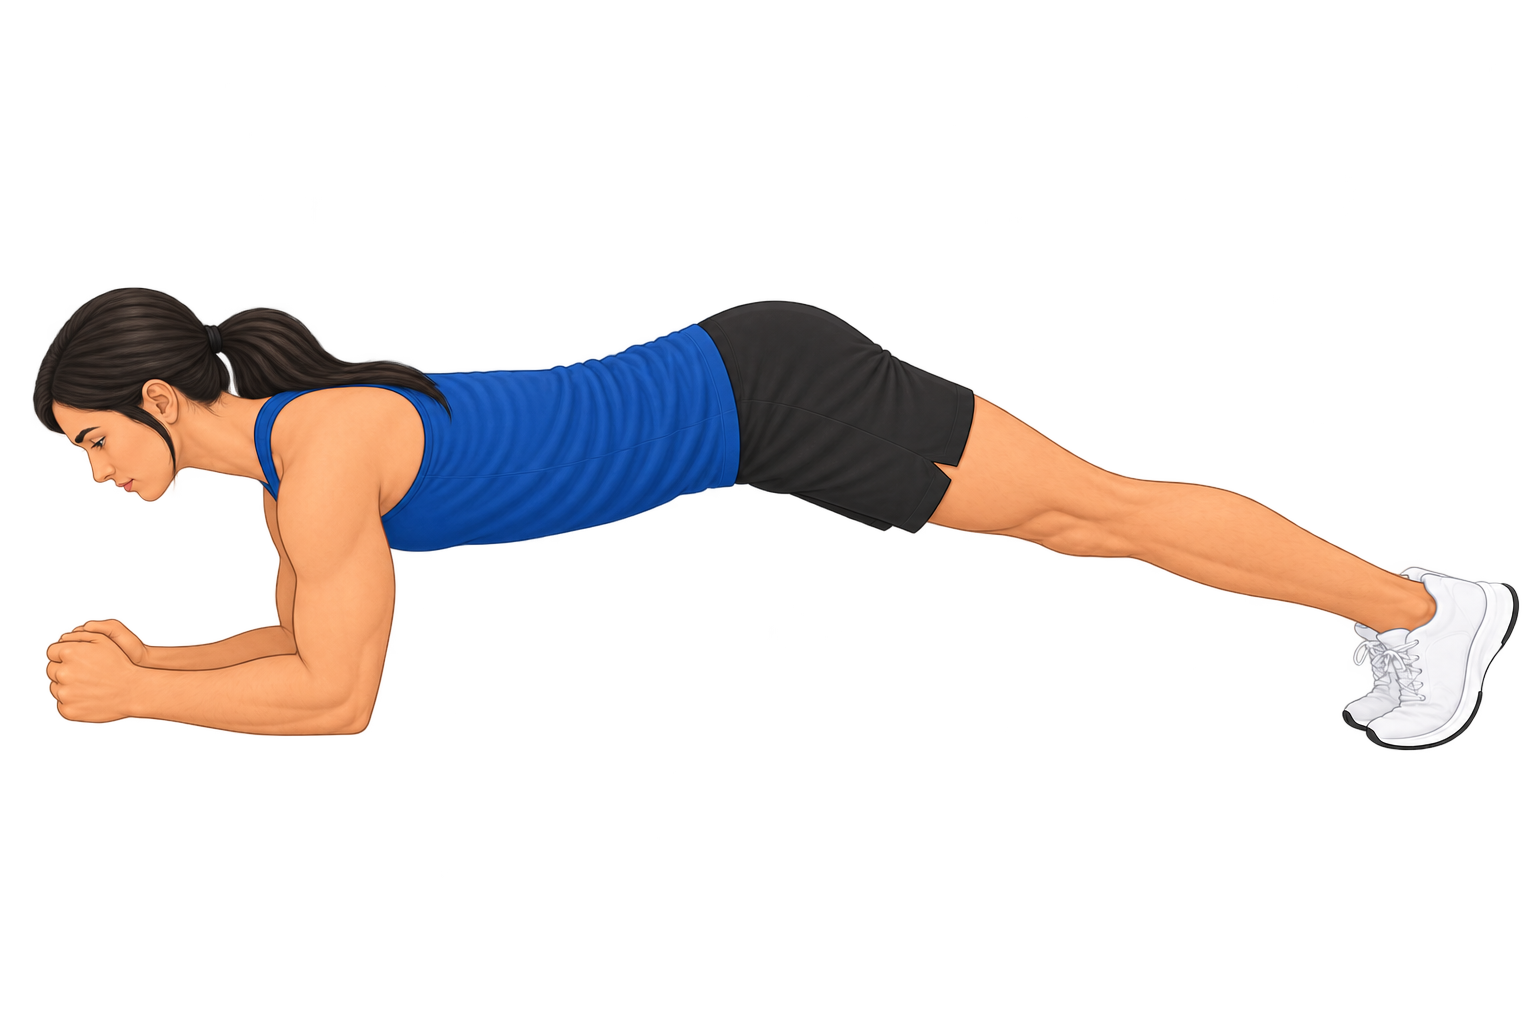
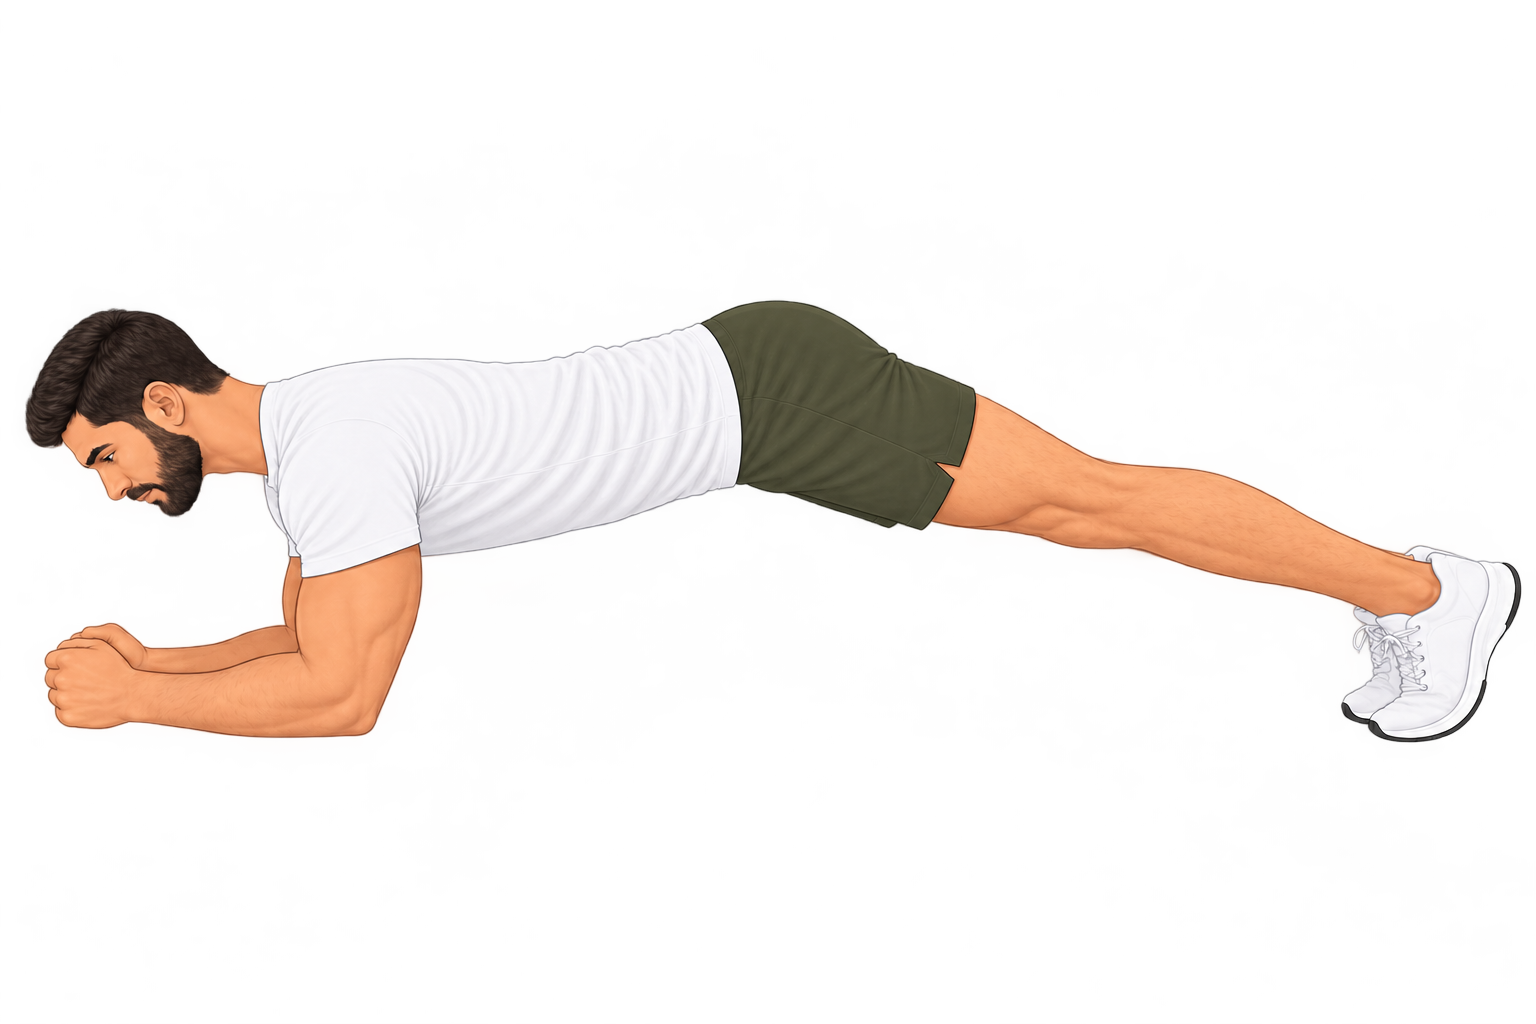
One forearm plank held as long as you can with good form. The images below show the correct position and the two ways form breaks, which end the test.
Shown from the side.
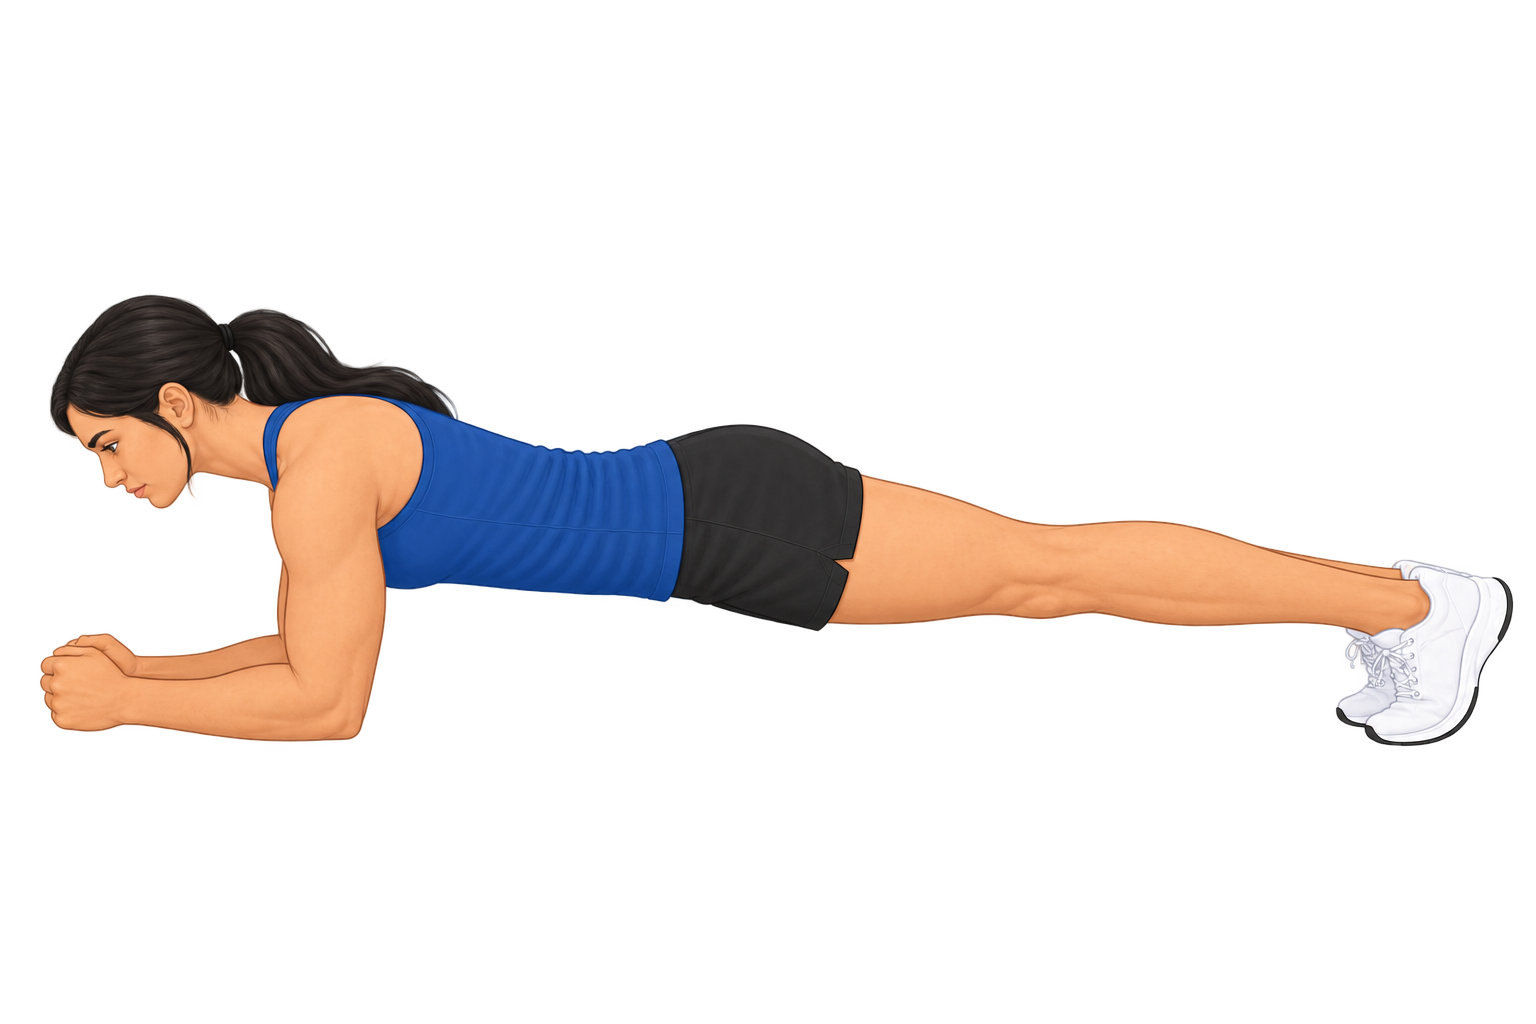
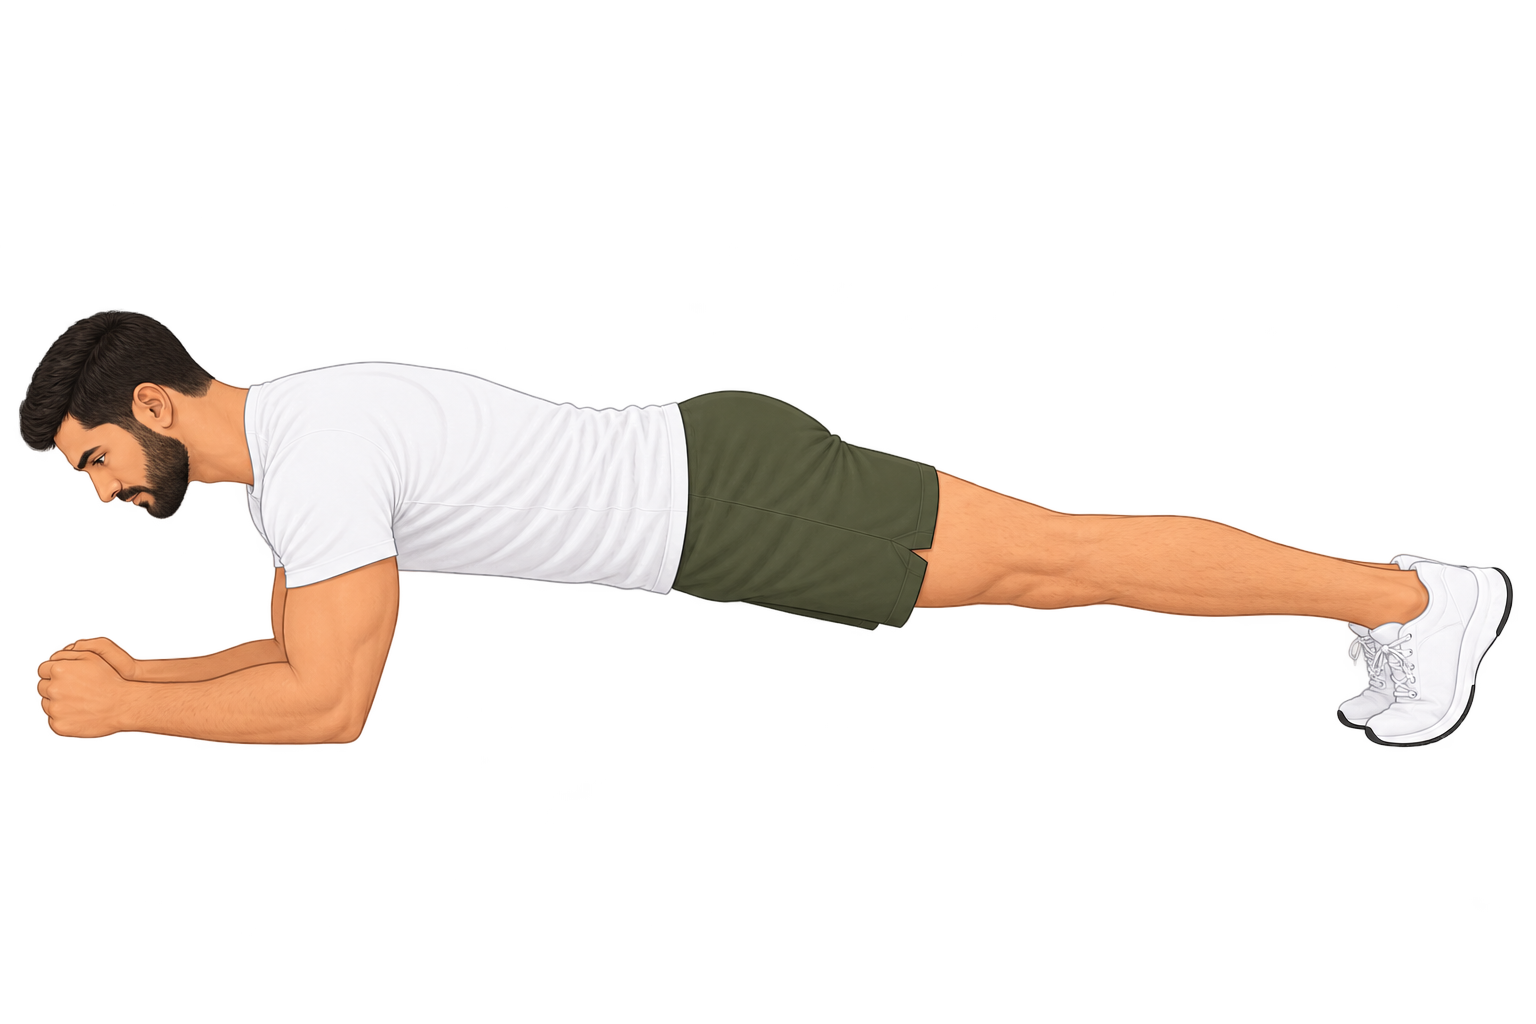
Straight Line
Forearms on the floor with your elbows under your shoulders, up on your toes. Keep one straight line from head to heels, brace your abs and glutes, and look at the floor just ahead of your hands. Start the timer once you’re in position.
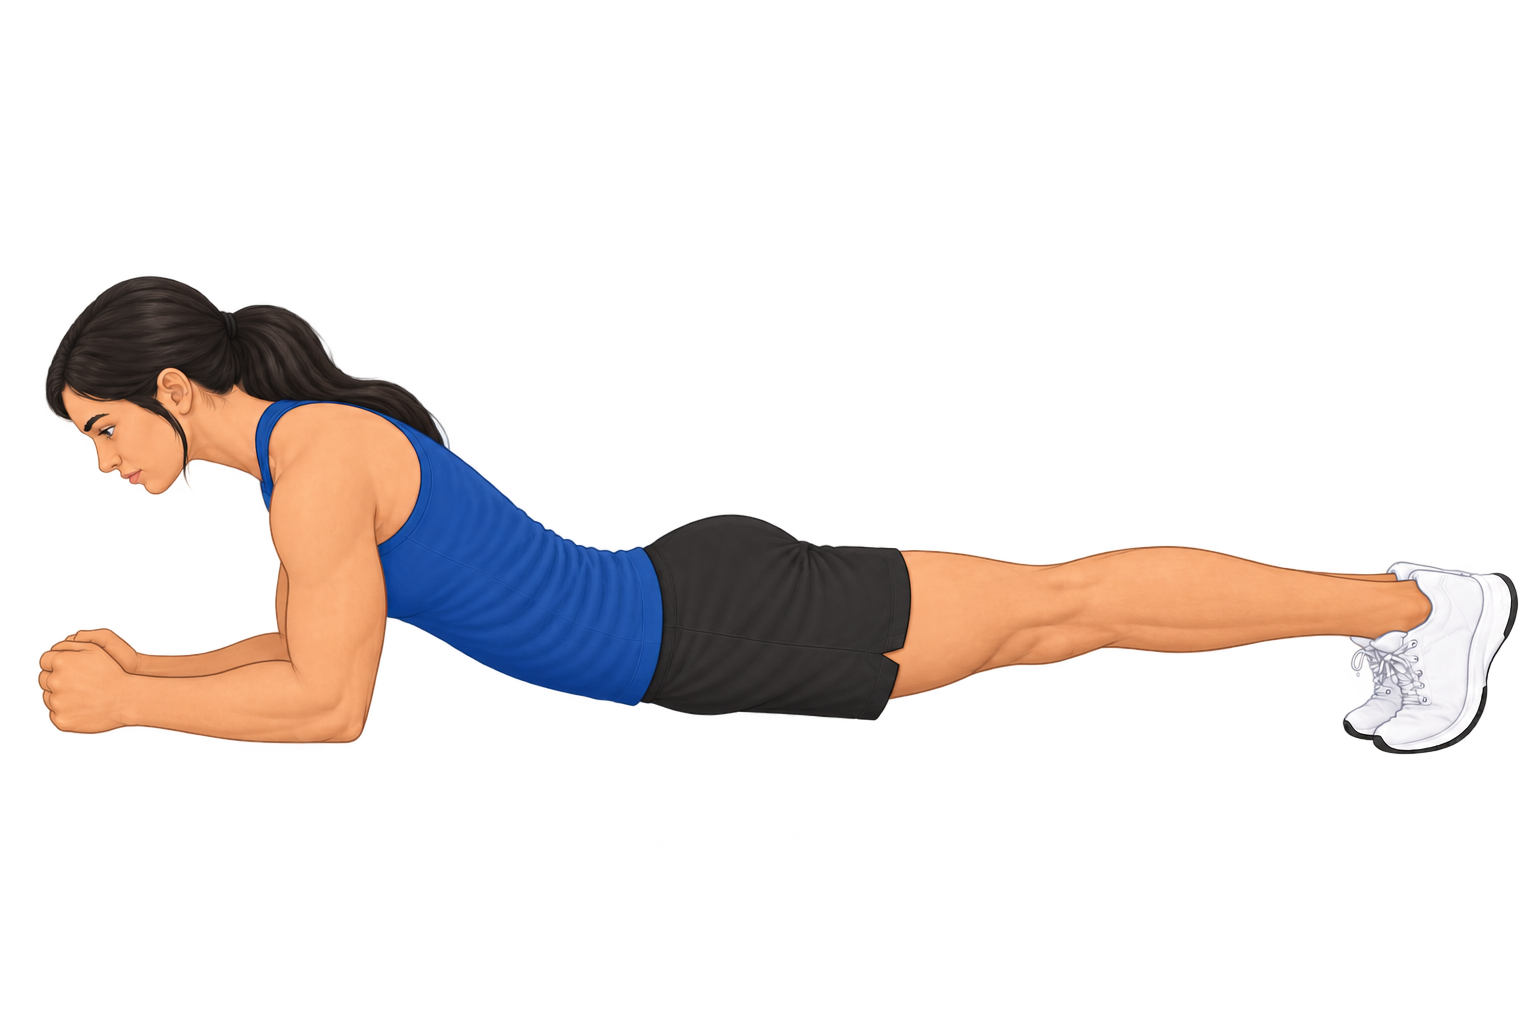
Hips Sag
Your hips drop below the line from shoulders to heels and your lower back arches. This is the most common way the test ends, and it loads the lower back.
Hips Pike
Your hips rise above the line and your body bends into an upside-down V. Lifting the hips takes load off the core, so the time no longer counts.
One attempt, no time limit. A partner watching from the side can tell you when your hips leave the line. Stop right away if you feel back pain. The calculator’s standards apply to this forearm plank only, not a straight-arm or knee plank.
Plank Technique Video
A short tutorial on forearm plank form: elbow position, body alignment, and keeping the hips level.
For the test: use the video for form only. The test is one forearm plank held as long as you can, with no time limit. Start the timer once you’re in position and stop it the moment your hips sag or rise or your form breaks. Only time in good form counts.
This video is from an external YouTube channel (ScottHermanFitness) and is not produced or endorsed by Amatal. It is shown for general technique reference only and is not medical or training advice. Programs and products promoted in the video or its description are the creator’s own.
How This Calculator Works
This calculator measures your core (trunk) muscular endurance using the front plank hold — one of the most widely used field assessments of trunk stability. You enter how long you can hold a correct plank to failure, and the calculator classifies your result against published normative data for the prone forearm plank, then computes your category, your Plank Age, an estimated percentile, and where you fall on a bell curve for your age and sex.
How These Standards Were Set
Strand and colleagues (2014) timed a forearm plank to failure in 194 men and 277 women and published the hold times at the 10th through 90th percentilesFor example, the 50th percentile is the time half the group held longer than: 1:50 for men and 1:12 for women.. Amatal’s tiers use different cutoffs (35th, 65th, 85th and 95th), so each cutoff is placed between Strand’s points on a normal-curve (z-score) scale. At age 20 that gives:
Women: Intermediate 1:01 · Advanced 1:30 · Superior 2:04 · Elite 2:51
Strand’s table stops at the 90th percentile, so the Elite cutoff (95th) is extrapolated by continuing the slope between the 80th and 90th percentiles. Each value is rounded up to a whole second once, and those same numbers drive your category, the table and the chart.
For every other age, the calculator multiplies the age-20 values by an Amatal estimated age curve: slightly higher in the late teens, then a gradual decline to about 60% of the age-20 values at 65 and about 50% at 75. Ages above 75 use the age-75 standards. This curve is a reasoned estimate, not published data.
Step 1: Enter Your Details
The calculator needs three inputs: your sex, your age, and your hold time.
- SexPlank norms are reported separately for men and women because of differences in trunk muscle mass, body proportions, and strength-to-weight ratio. In the source data, men held significantly longer than women on average. — selects which normative table you are compared against.
- Age — determines the performance standards expected for your stage of life.
- Hold TimeEntered in minutes and seconds. This is the total time you maintained a correct plank position before form broke down or you stopped. — the total time you held a correct plank continuously, with good form, until you could no longer maintain the position.
The Test Protocol
For results that match the norms, the test must be performed the same way the norms were collected — a standardized prone forearm plank:
- Starting position: Face-down, supported on your forearms and toes. Elbows directly under the shoulders, forearms parallel, body lifted into a straight line from head to heels.
- Body line: Keep the spine neutral — no sagging hips, no piking the hips upward, head in line with the spine. Brace the abdominals and glutes throughout.
- Timing: The clock starts once you hold a correct position and runs continuously.
- To failure: Hold as long as possible. The test ends when your form breaks down — hips drop or rise, you can no longer hold the line, or you voluntarily stop. In Strand’s study, the tester gave brief form cues and stopped the test if two cues in a row didn’t fix the position. Time held in broken form does not count.
- One attempt: Strand’s participants did one maximal hold, with no time limit.
How Your Category Is Determined
The source data report plank performance as percentile norms for each age-and-sex group rather than as named ratings. To keep every assessment on this platform consistent, those percentiles are mapped onto the same five-tier scale used across the site:
Elite ≈ 95th · Superior ≈ 85th · Advanced ≈ 65th · Intermediate ≈ 35th · Low = below the 35th percentile
Your hold time is compared against the minimum time required for each tier at your age and sex, and you are placed in the highest tier you qualify for:
- Low — below the typical range for your group. Below roughly the 35th percentile. A clear starting point with substantial room for improvement.
- Intermediate — around the middle of the group (35th to 65th percentile). Around the median of the reference group.
- Advanced — above average for your group. Roughly the 65th percentile and up. Reflects consistent core training.
- Superior — well above average. Roughly the 85th percentile and up. Characteristic of well-conditioned individuals.
- Elite — top tier for your age and sex. Roughly the 95th percentile and up. This cutoff is extrapolated beyond the published data.
How to Read the Standards Table
The standards table lists one row for every five years of age from 15 to 75, plus an extra row for your exact age, and one column for each of the five levels. The header labels are color-coded to match the chart bands — on a phone the headers shorten to single letters (L · I · A · S · E); tap any header to see its full name.
- Each cell is a single time — the minimum. It shows the shortest hold needed to reach that level at that age. If your result equals or exceeds it, you've reached that level.
- The Low column shows a range. Low runs from zero up to one second below the Intermediate minimum, so it is shown as a range rather than a threshold.
- Your row and level are highlighted. The row for your exact age is shaded, and within it, the cell for your achieved level is filled with that tier's color.
Plank Age
Your Plank AgeThe age at which your hold time would be considered typical (median) performance. Conceptually similar to "fitness age" used in cardiovascular testing. is the age at which your result would be average. If you hold a plank longer than the typical person of your actual age, your Plank Age is younger; if shorter, it is older.
The typical hold at each age is Strand’s 50th-percentile time scaled by the estimated age curve. The curve runs from 18 to 75, so a hold at or above the typical 18-year-old shows as ≤18, and a hold below the typical 75-year-old shows as 75+.
Percentile Estimate
The percentile estimates the share of people of your age and sex who hold for less time than you. Your hold is placed between Strand’s 10th–90th percentile times, scaled to your age, on the same z-score scale used for the tiers, so the percentile always agrees with your category:
Beyond the published range the calculator doesn’t guess: holds above the 90th percentile show as >90th, and holds below the 10th show as <10th.
The Bell Curve
The “Where You Fall in Your Age Group” chart draws a normal curveA bell-shaped curve that describes how results spread around an average: most people near the middle, fewer at either end. fitted to Strand’s 10th–90th percentile times and scaled to your age. The colored bands are the five tiers, and the dashed line marks your hold.
Real plank times are right-skewed: most people cluster at shorter holds, with a long tail of very long ones. A symmetric bell can’t show that exactly, so the curve is a positioning aid. Your category and percentile come from the published points, not from the curve.
How Age and Sex Change Your Score
These two inputs do not just describe you — each one directly changes the numbers your result is measured against:
- Age changes the thresholds. The calculator recomputes the time requirement for every tier at your exact age. On the estimated age curve, the requirements decline gradually after the late teens, so an identical plank can place you in a higher tier at 55 than it would at 25. Remember that every age other than 20 is an estimate.
- Sex selects a different table. Choosing male or female swaps in an entirely separate set of normative values. In the source data men held significantly longer on average than women, so the times required for each tier differ between the two — the same hold is scored against different benchmarks depending on which table applies.
Why Core Endurance Matters
Plank capacity is more than a gym benchmark. The endurance of the trunk-stabilizing muscles is what lets your spine stay supported under load, and reduced trunk muscular endurance has been associated with low back pain in the research literature. McGill and colleagues (1999) published reference hold times for healthy young adults on related trunk holds, which clinicians use as practical targets for testing and training.
Important context: most plank normative data comes from relatively small samples and specific populations (often college-aged or athletic groups), and the relationship to back health is an association, not proof that planks themselves prevent injury. Still, core endurance is a meaningful marker of functional fitness — it underpins posture, transfers force between the upper and lower body, and supports almost every everyday lifting, carrying, and bracing task.
Data Sources and Verification
The age-20 norms come from Strand et al. The age curve is an Amatal estimate. The other references support the protocol and context:
- Strand, S.L., Hjelm, J., Shoepe, T.C., & Fajardo, M.A. (2014). Norms for an Isometric Muscle Endurance Test. Journal of Human Kinetics, 40, 93–102 — percentile norms (10th–90th) for the forearm plank in 471 college students (194 men, 277 women, mean age about 20). Source of the age-20 standards and the percentile points.
- McGill, S.M., Childs, A., & Liebenson, C. (1999). Endurance times for low back stabilization exercises: clinical targets for testing and training from a normal database. Archives of Physical Medicine and Rehabilitation, 80(8), 941–944 — reference hold times for healthy young adults on related trunk holds (not the plank).
- Bohannon, R.W., et al. (2018). The prone bridge test: performance, validity, and reliability among older and younger adults. Journal of Bodywork and Movement Therapies, 22(2), 385–389 — compared prone bridge (plank) times in younger (20–35) and older (60–79) adults, finding shorter holds in the older group. Context only; its data are not used in the calculations.
- Tong, T.K., Wu, S., & Nie, J. (2014). Sport-specific endurance plank test for evaluation of global core muscle function. Physical Therapy in Sport, 15(1), 58–63 — plank testing methodology.
- ACSM's Guidelines for Exercise Testing and Prescription (11th Edition, 2021) — the authoritative reference framework for field muscular-endurance testing.
Limitations and Important Caveats
This calculator provides an estimate, not a clinical measurement. Several factors affect how precisely it reflects your true core endurance:
- One young sample. The published norms come from one group of college students, about a quarter of them varsity athletes. They may not represent the general adult population.
- Estimated age curve. Every age other than 20 uses an Amatal estimated curve, not measured data. Ages above 75 use the age-75 standards.
- Extrapolated Elite. The Elite cutoff (95th percentile) lies beyond Strand’s published 90th percentile and is extrapolated.
- Form and timing variability. What counts as a "broken" plank — how much hip sag is allowed, head position, when the clock stops — varies from person to person. Inconsistent form is the largest source of error in a self-administered plank test.
- Body leverage. Limb length, body weight, and proportions influence how hard each second of holding is, independent of muscular fitness. Two equally fit people can score differently.
- Pacing and motivation. The plank is a maximal hold, so tolerance for discomfort and pacing strongly affect the result — sometimes more than raw muscular capacity.
- Single-test snapshot. Fatigue, sleep, time of day, and recent training all affect a single test. For tracking progress, retest under the same conditions every few weeks.
Disclaimer:
This calculator provides an estimate based on published norms from college students at age 20 and an Amatal estimated age curve for all other ages. Real core endurance depends on training history, technique, body proportions, recovery, and individual variation. Always warm up before any fitness test and stop immediately if you experience pain, dizziness, or unusual discomfort. This tool is for general informational purposes only and should not be considered medical, fitness, or training advice. Consult a healthcare provider before beginning a new exercise program, especially if you have a pre-existing condition, are over the age of 45, or have been sedentary for an extended period.